America’s urban highways were as crowded as parking lots on many days in 2019 — as they had been for decades. As the COVID-19 pandemic quickly shuttered offices across the country in 2020, even the most trafficked roads in places like New York City and Los Angeles became the equivalent of ghost towns. The decline in traffic was so sharp that, according to the U.N., air quality improved markedly in many metropolitan areas.
Car traffic volume, pollution, and long waiting times snapped back to near pre-pandemic levels last year as more urban offices, restaurants, and theaters reopened. In addition, in some cities where people worried about the spread of the virus on public transportation, commuters turned to cars. The increase was sharp enough that traffic jams and congestion returned, at times even at levels greater than in 2019.
Map and geolocation company TomTom tracks millions of cars via smartphones and vehicle map systems. Its technology has become part of the creation of self-driving car systems.
TomTom released a study titled “Traffic Index Ranking 2021.” Traffic data, gathered from 404 cities in 58 countries across six continents, was used to analyze traffic patterns in cities throughout a 24 hours day and for 365 days. This allowed the researchers to determine traffic levels at rush hour and at times in the day when there were fewer cars on the road. The information was also used to determine the percent of time that roads and highways in a city were congested.
To determine the American cities with the best commutes, 24/7 Wall St. reviewed TomTom’s Traffic Index. Time lost in traffic per year is defined as the extra travel time as compared to a one-hour period during free-flow conditions multiplied by 230 working days per year. Congestion levels represent the percentage of extra time a trip might take in traffic as compared to baseline uncongested conditions. Population figures are five-year estimates for 2020 from the U.S. Census Bureau.
By global standards, no U.S. city has roads that are highly congested. Forty-two cities are ahead of New York City, which sits atop the list for American metros with 80 hours of time lost in traffic each year. In Istanbul (142 hours a year lost in traffic), Moscow (140), Kyiv (128), Bogata (126) and Mumbai (121), the hours lost are over 120. (These are the cities where people lose the most time driving each year.)
In fact, several of America’s cities have among the best commute times in the world. The lowest among the U.S. cities measured is Greensboro, North Carolina, at 18 hours lost a year to traffic. The congestion rate on an average day in Greensboro is only 8%. The comparable time in New York City is 35%. (Find out if Greensboro is also among the safest cities for driving.)
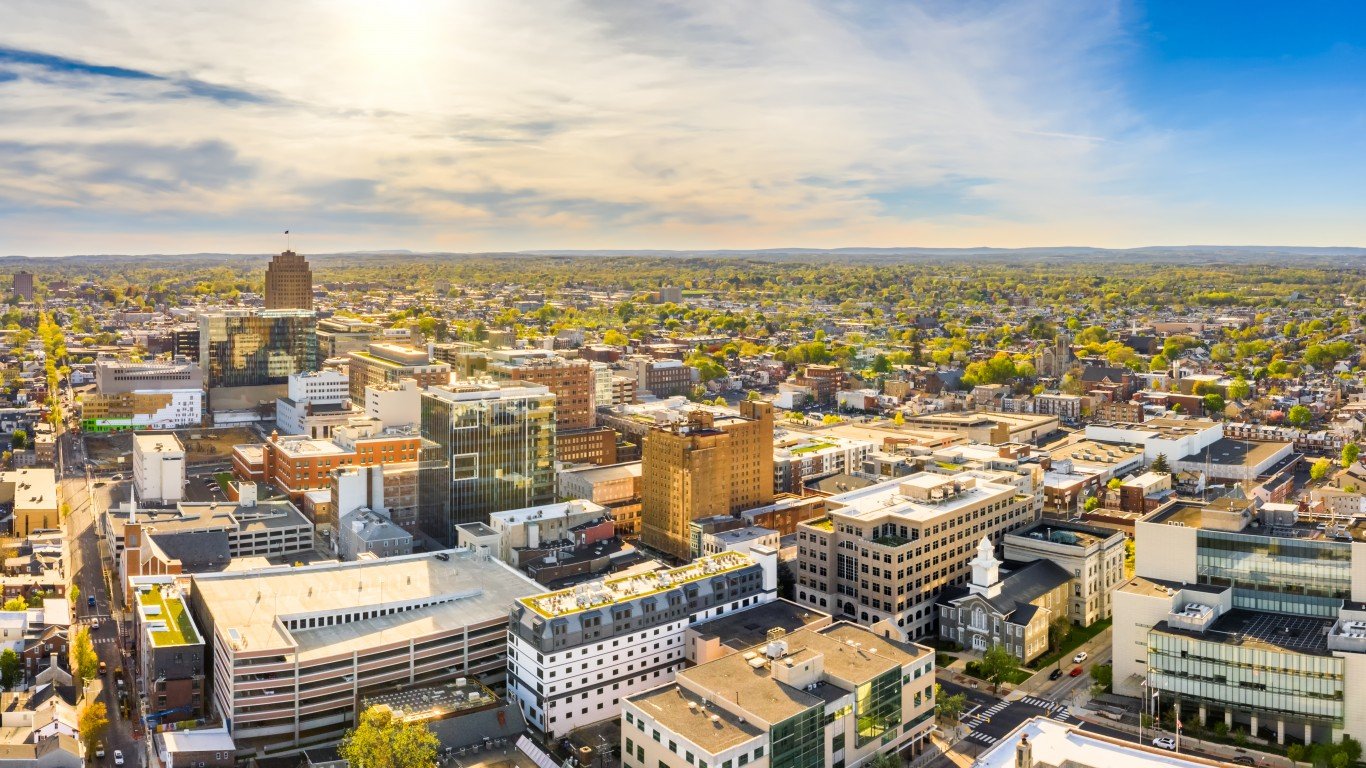
30. Allentown, PA
> Time lost in traffic each year: 32 hours
> Average congestion level, 2021: 14%
> World rank: #346 worst congestion
> Population: 121,156
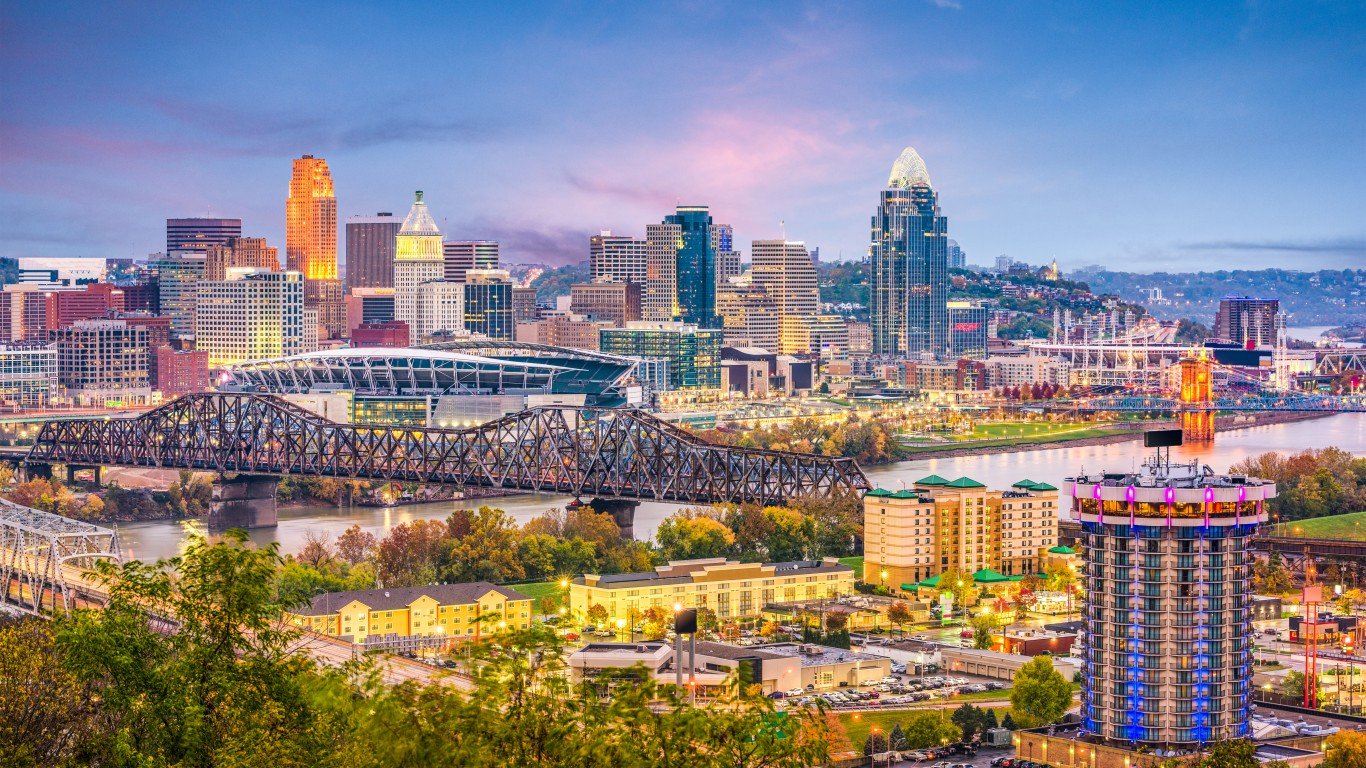
29. Cincinnati, OH
> Time lost in traffic each year: 32 hours
> Average congestion level, 2021: 14%
> World rank: #347 worst congestion
> Population: 302,687
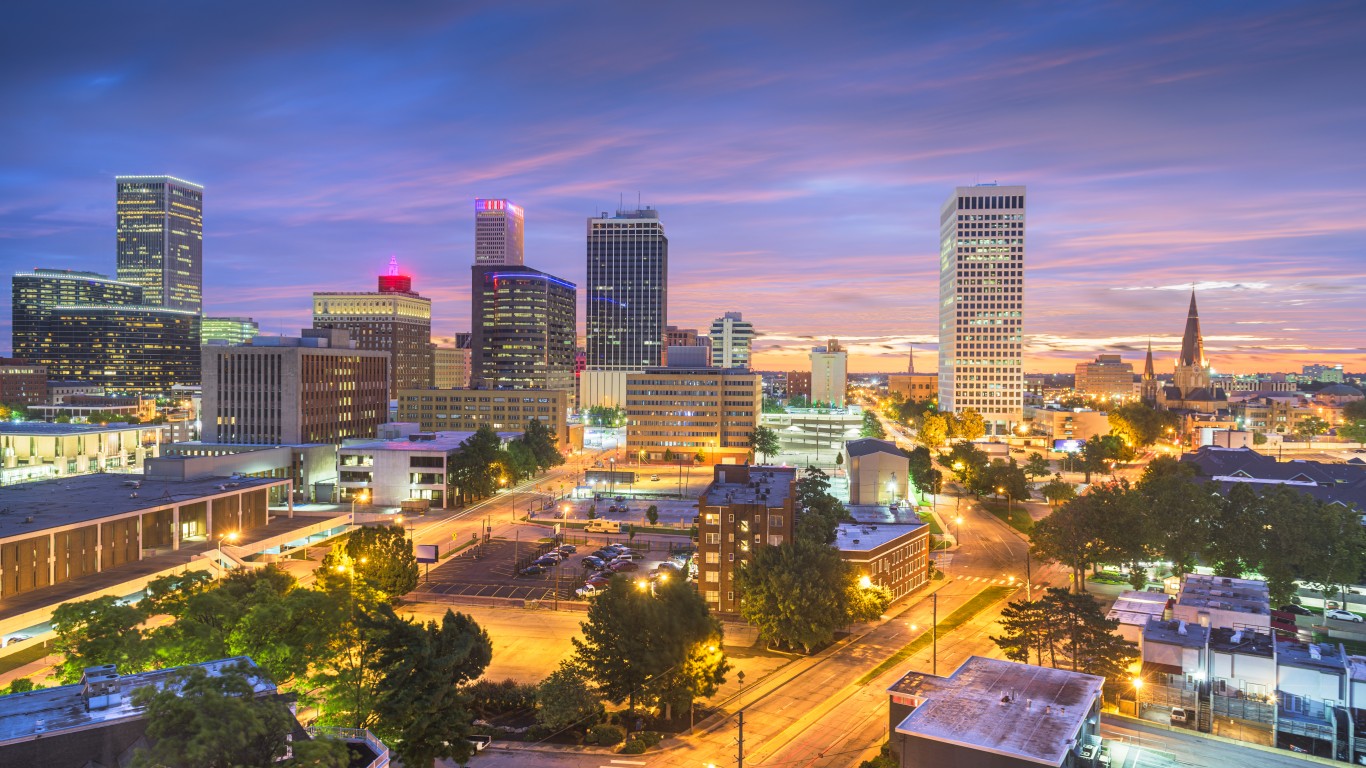
28. Tulsa, OK
> Time lost in traffic each year: 32 hours
> Average congestion level, 2021: 14%
> World rank: #354 worst congestion
> Population: 402,441
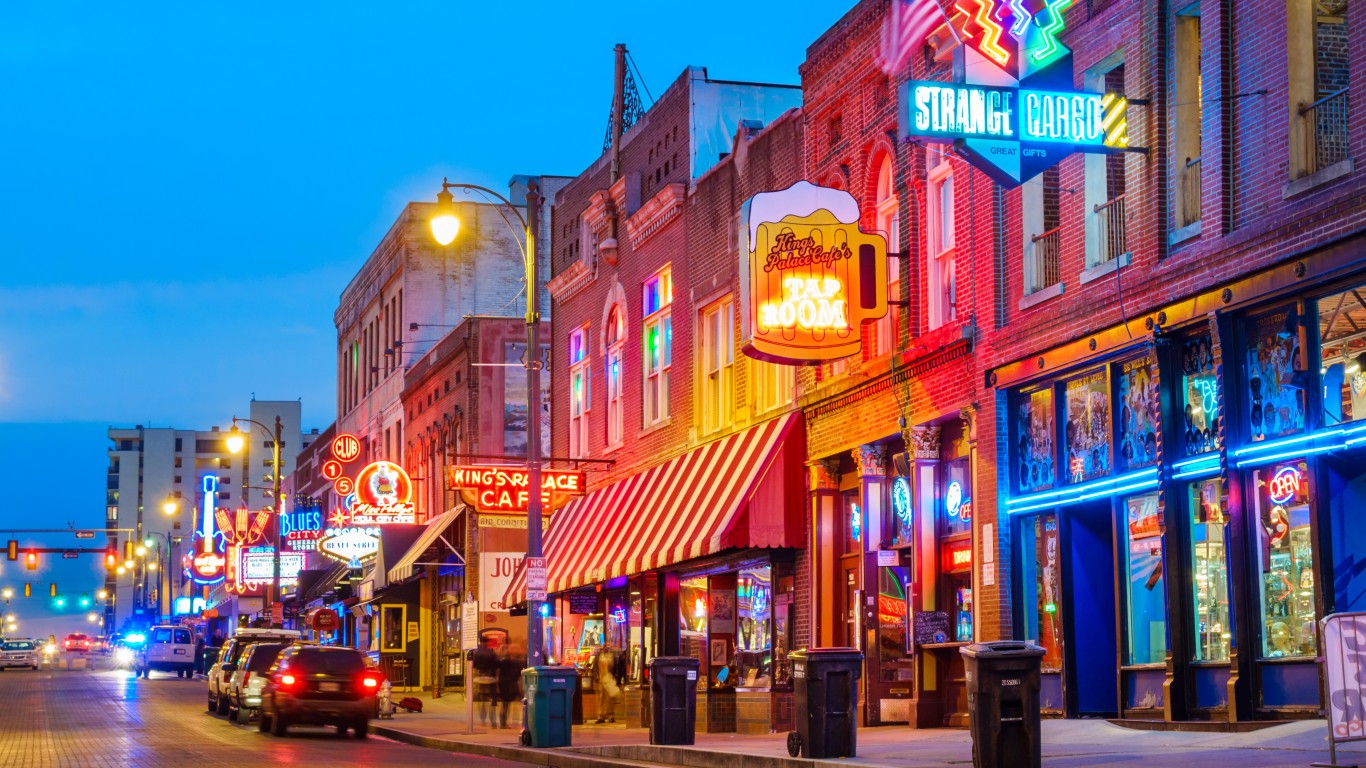
27. Memphis, TN
> Time lost in traffic each year: 32 hours
> Average congestion level, 2021: 14%
> World rank: #355 worst congestion
> Population: 650,910
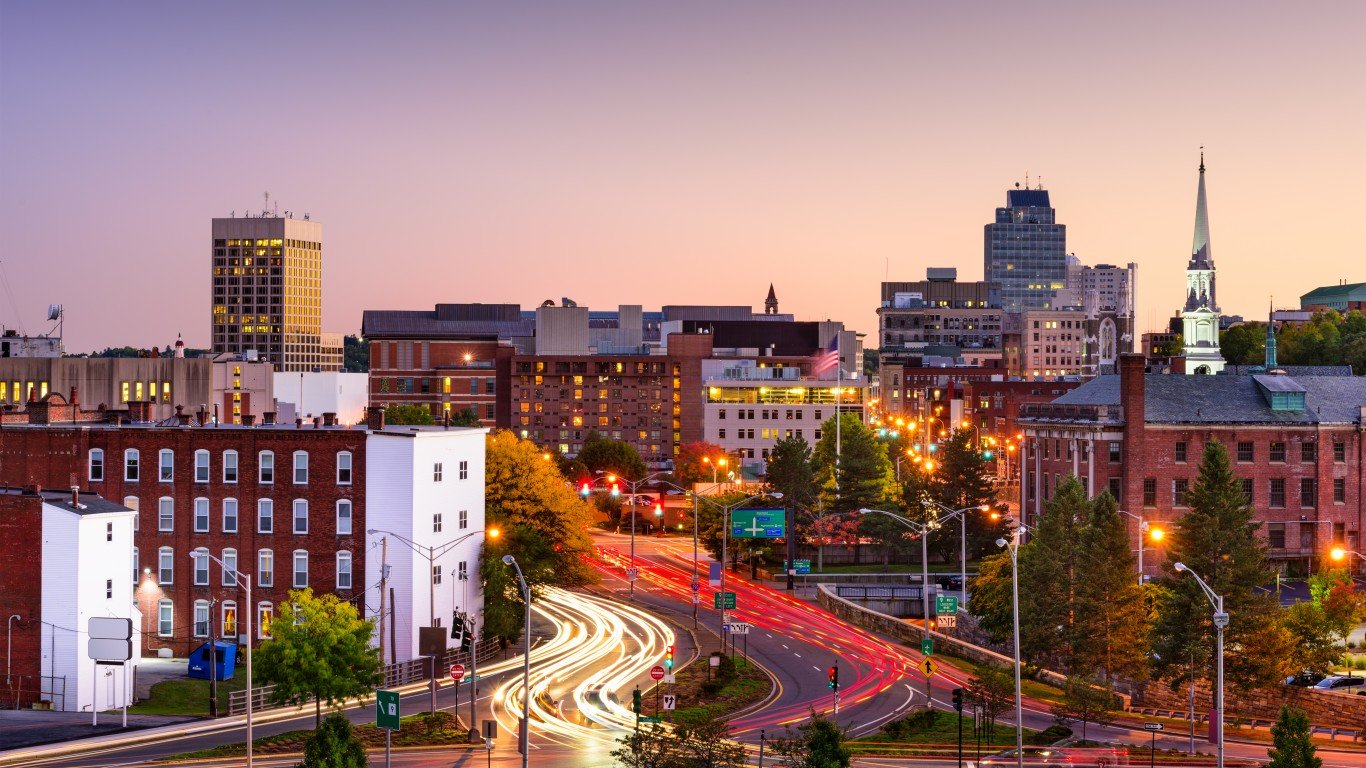
26. Worcester, MA
> Time lost in traffic each year: 32 hours
> Average congestion level, 2021: 14%
> World rank: #357 worst congestion
> Population: 185,186
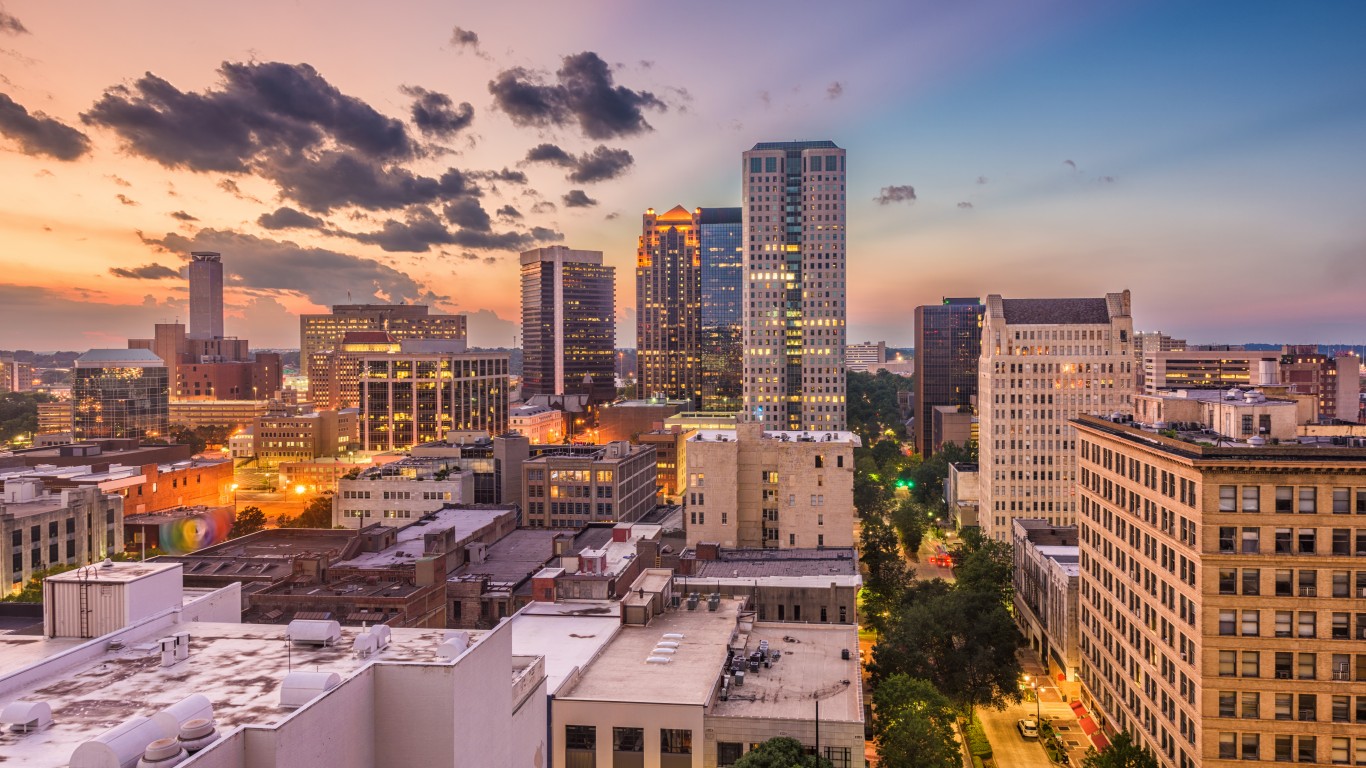
25. Birmingham, AL
> Time lost in traffic each year: 32 hours
> Average congestion level, 2021: 14%
> World rank: #359 worst congestion
> Population: 210,928
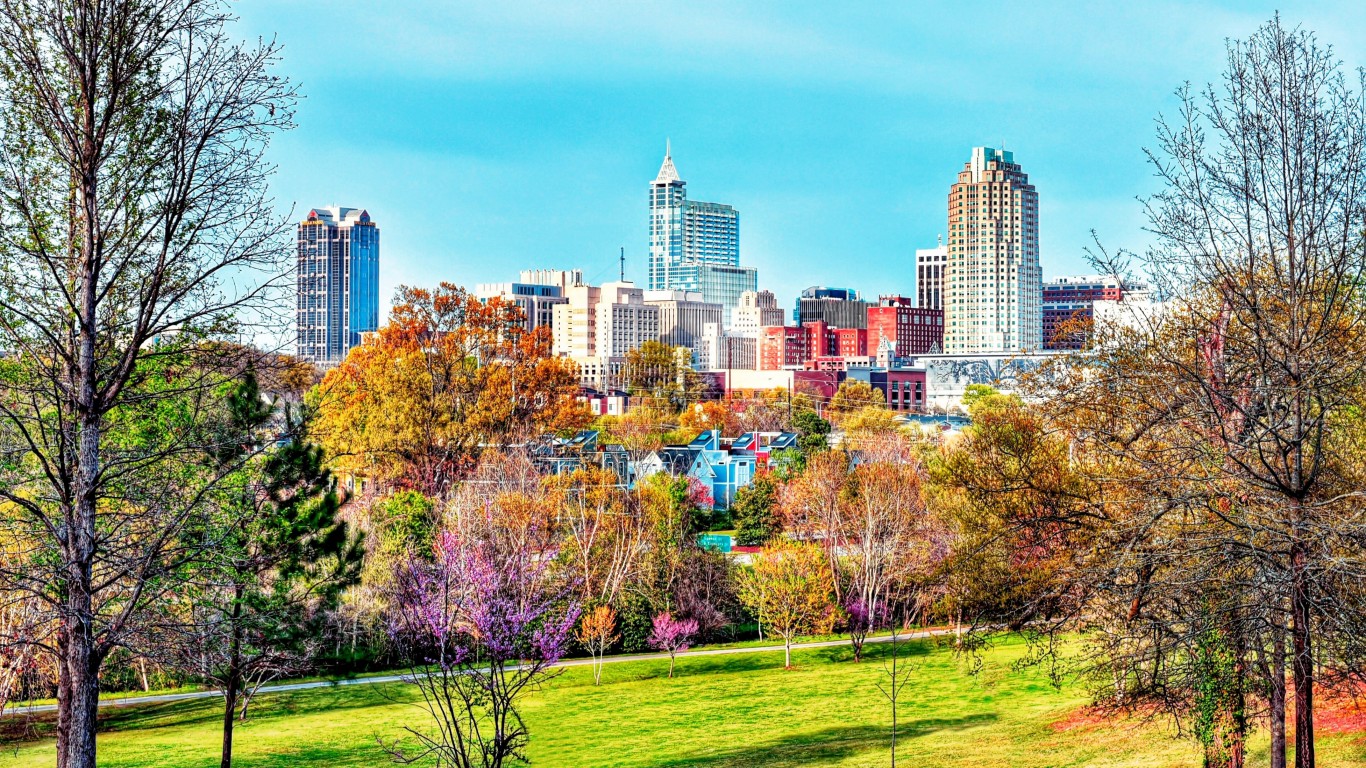
24. Raleigh, NC
> Time lost in traffic each year: 32 hours
> Average congestion level, 2021: 14%
> World rank: #361 worst congestion
> Population: 469,698
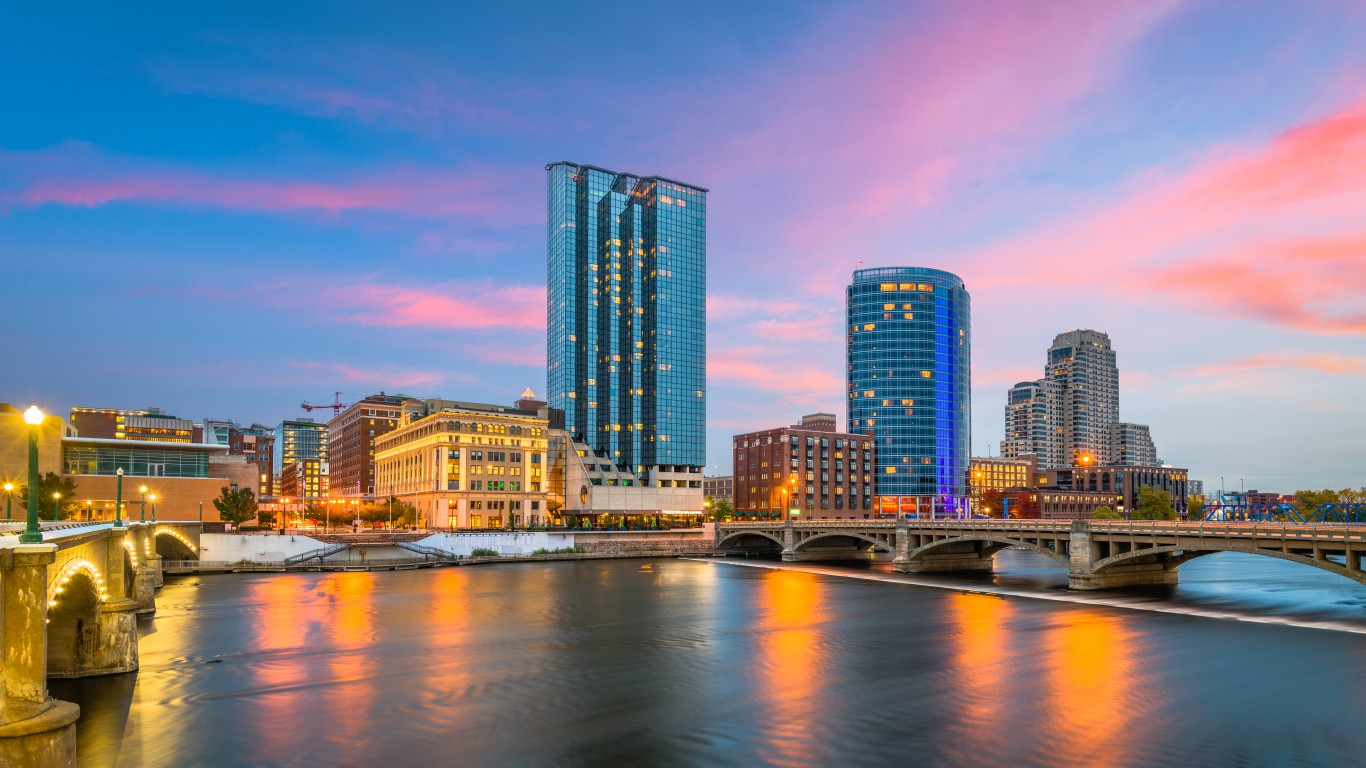
23. Grand Rapids, MI
> Time lost in traffic each year: 29 hours
> Average congestion level, 2021: 13%
> World rank: #367 worst congestion
> Population: 199,417
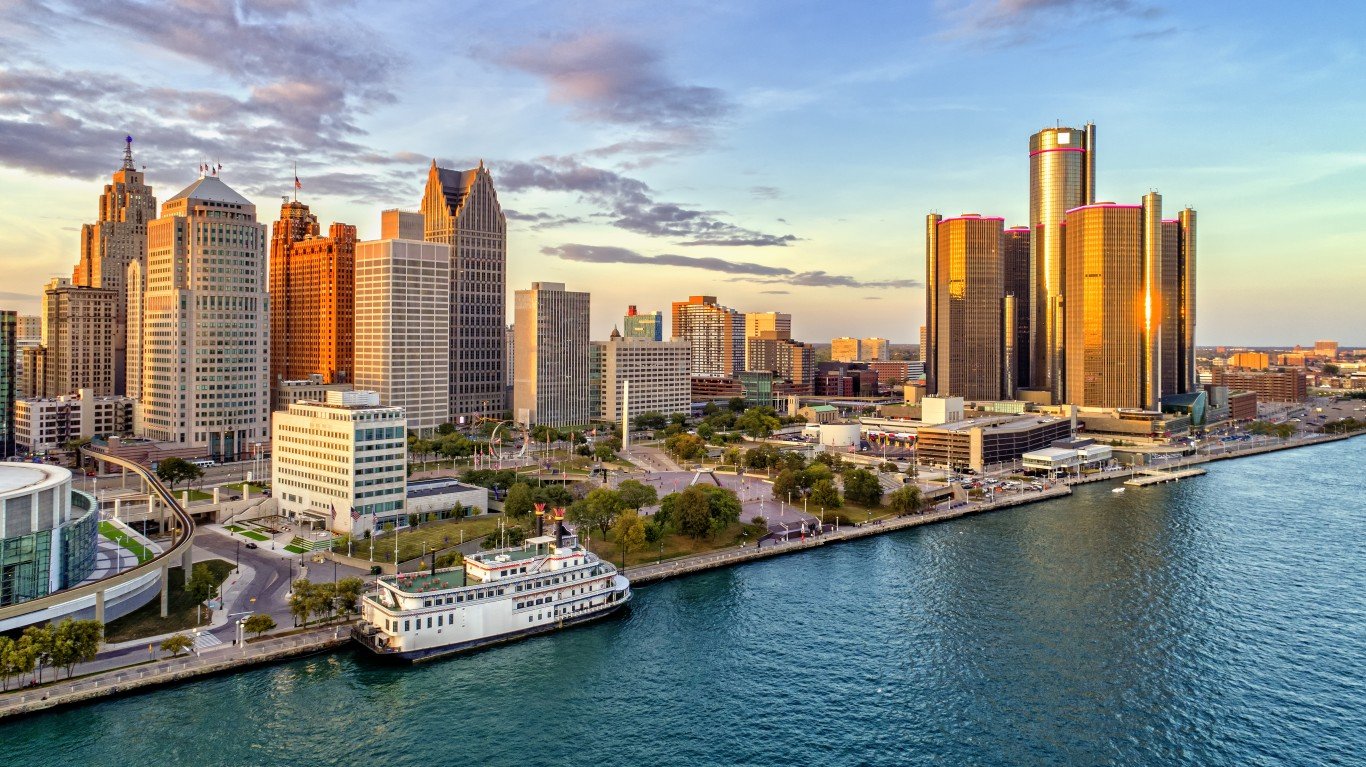
22. Detroit, MI
> Time lost in traffic each year: 29 hours
> Average congestion level, 2021: 13%
> World rank: #368 worst congestion
> Population: 672,351
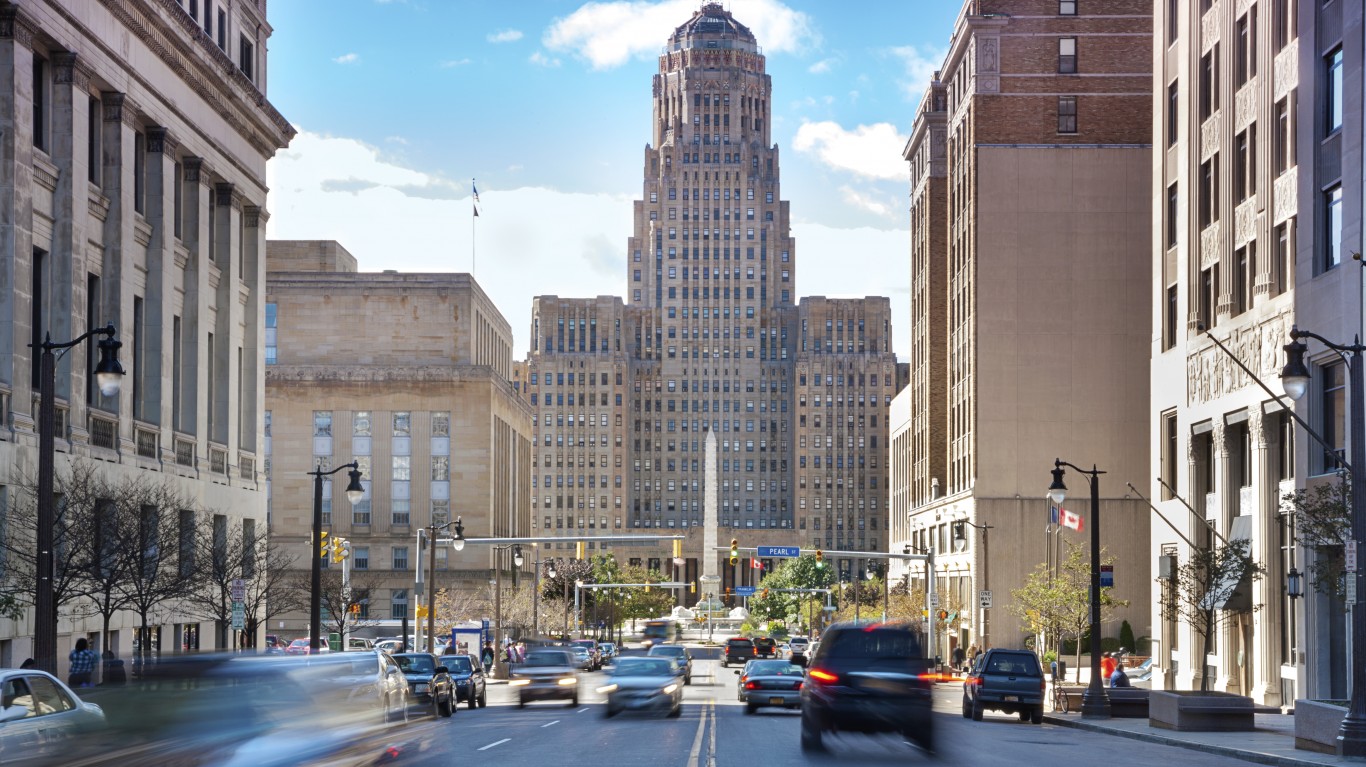
21. Buffalo, NY
> Time lost in traffic each year: 29 hours
> Average congestion level, 2021: 13%
> World rank: #369 worst congestion
> Population: 255,805
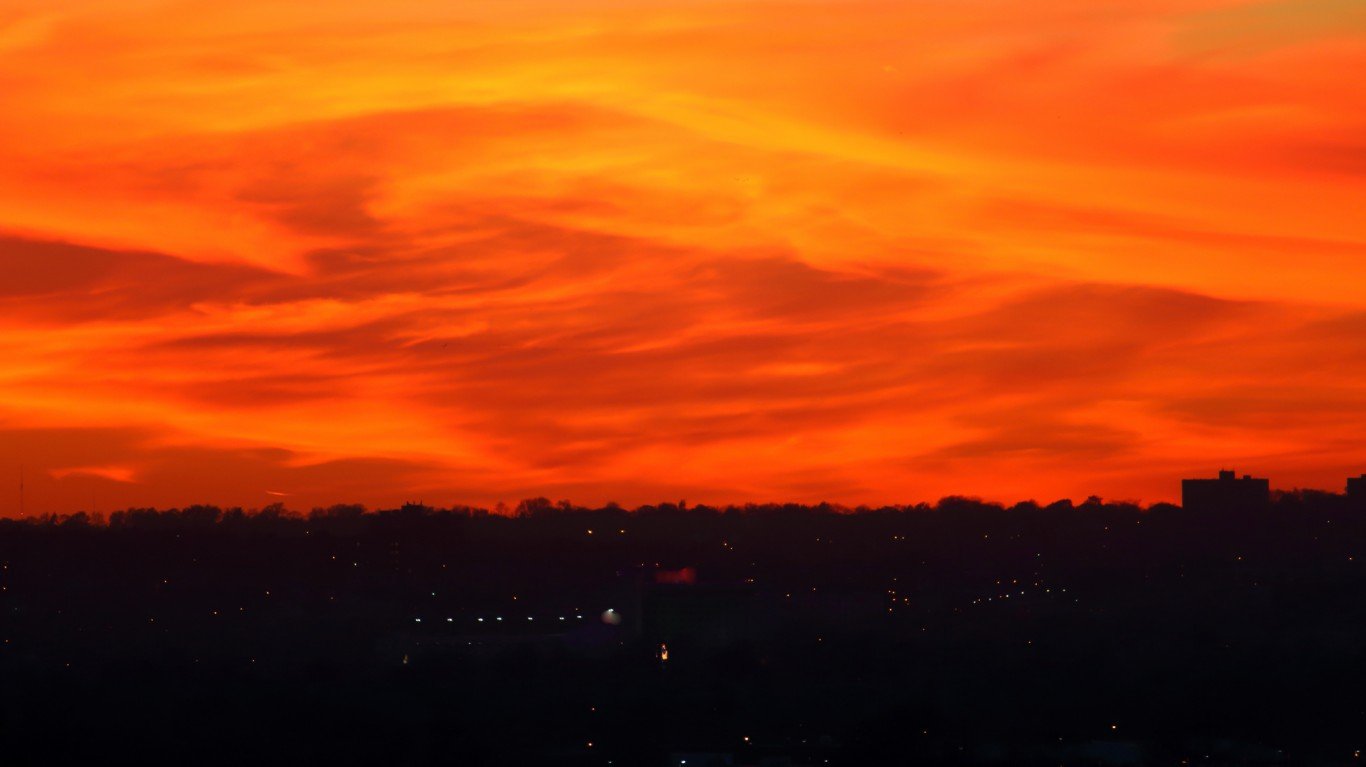
20. Omaha-Council Bluffs, NE
> Time lost in traffic each year: 29 hours
> Average congestion level, 2021: 13%
> World rank: #371 worst congestion
> Population: 479,529
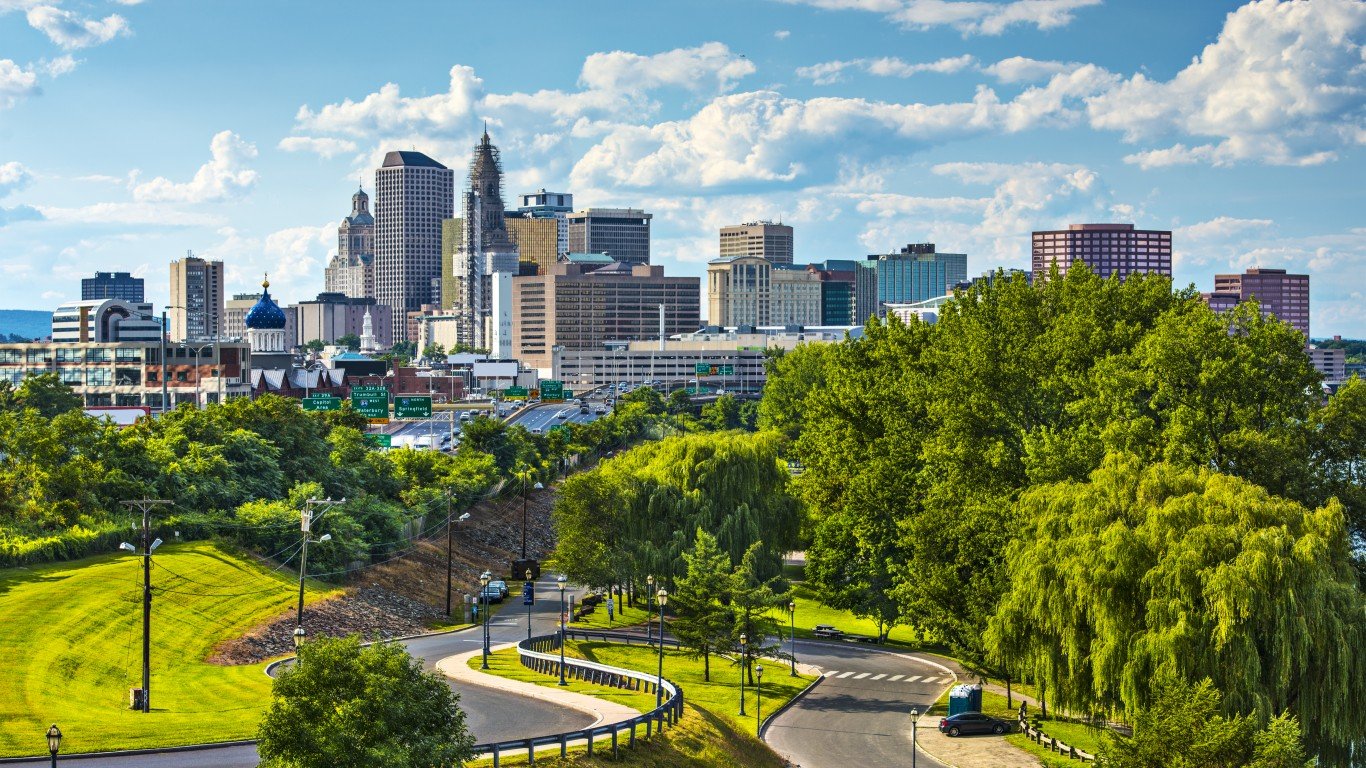
19. Hartford, CT
> Time lost in traffic each year: 29 hours
> Average congestion level, 2021: 13%
> World rank: #372 worst congestion
> Population: 122,549
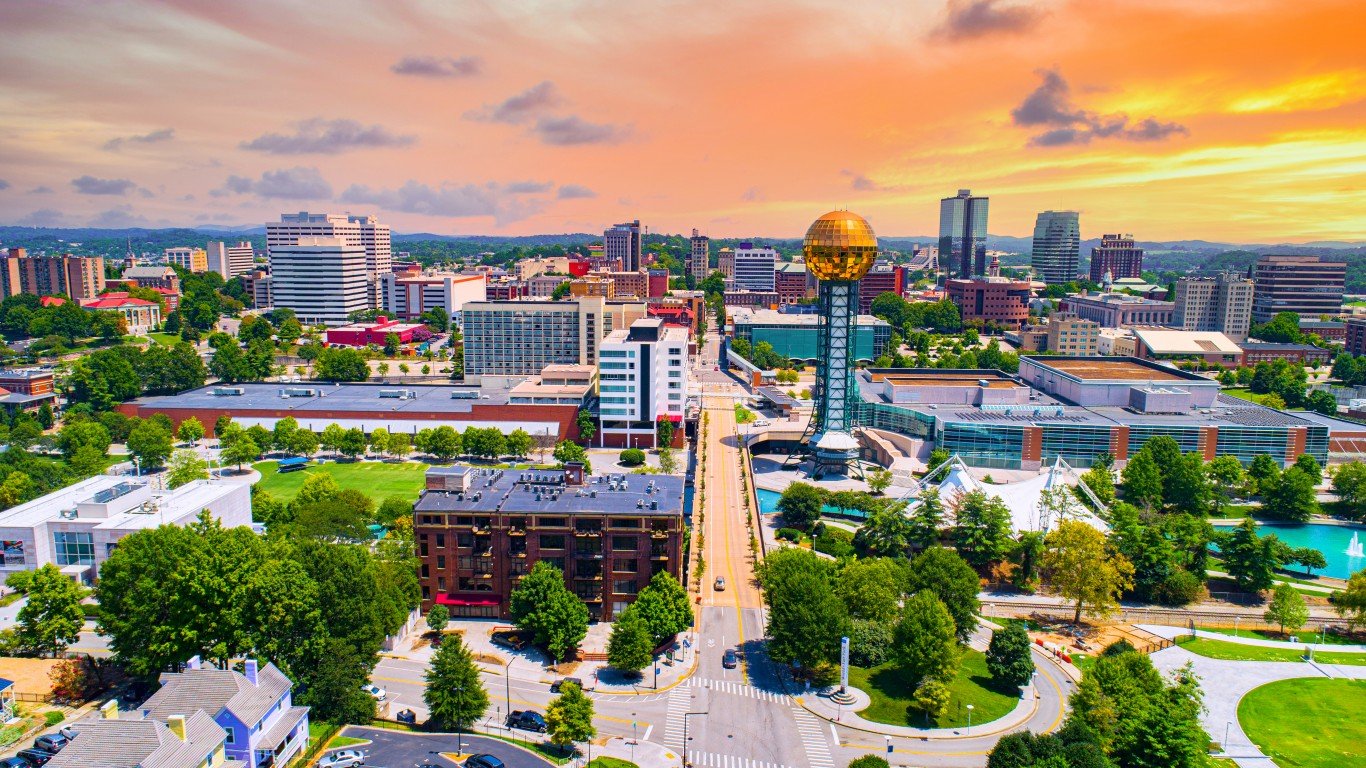
18. Knoxville, TN
> Time lost in traffic each year: 29 hours
> Average congestion level, 2021: 13%
> World rank: #377 worst congestion
> Population: 187,487
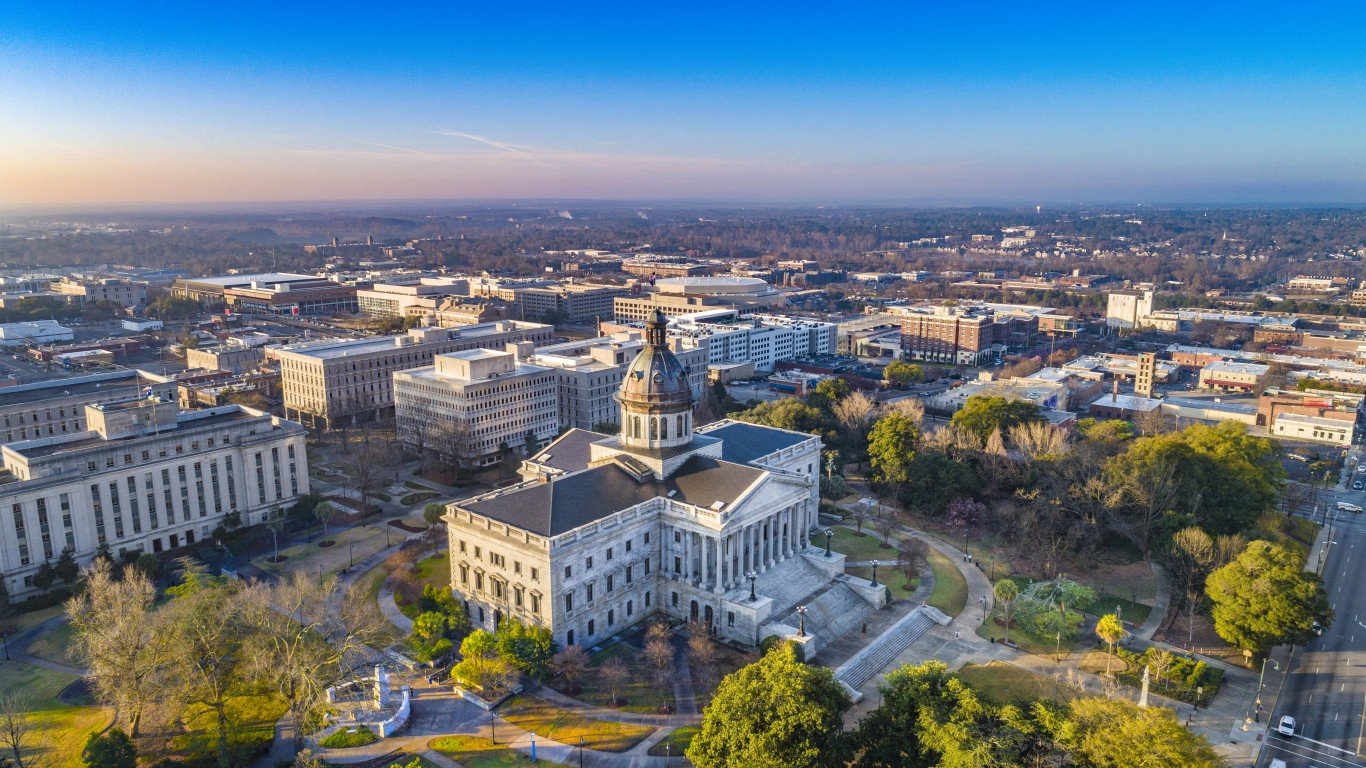
17. Columbia, SC
> Time lost in traffic each year: 29 hours
> Average congestion level, 2021: 13%
> World rank: #378 worst congestion
> Population: 134,057
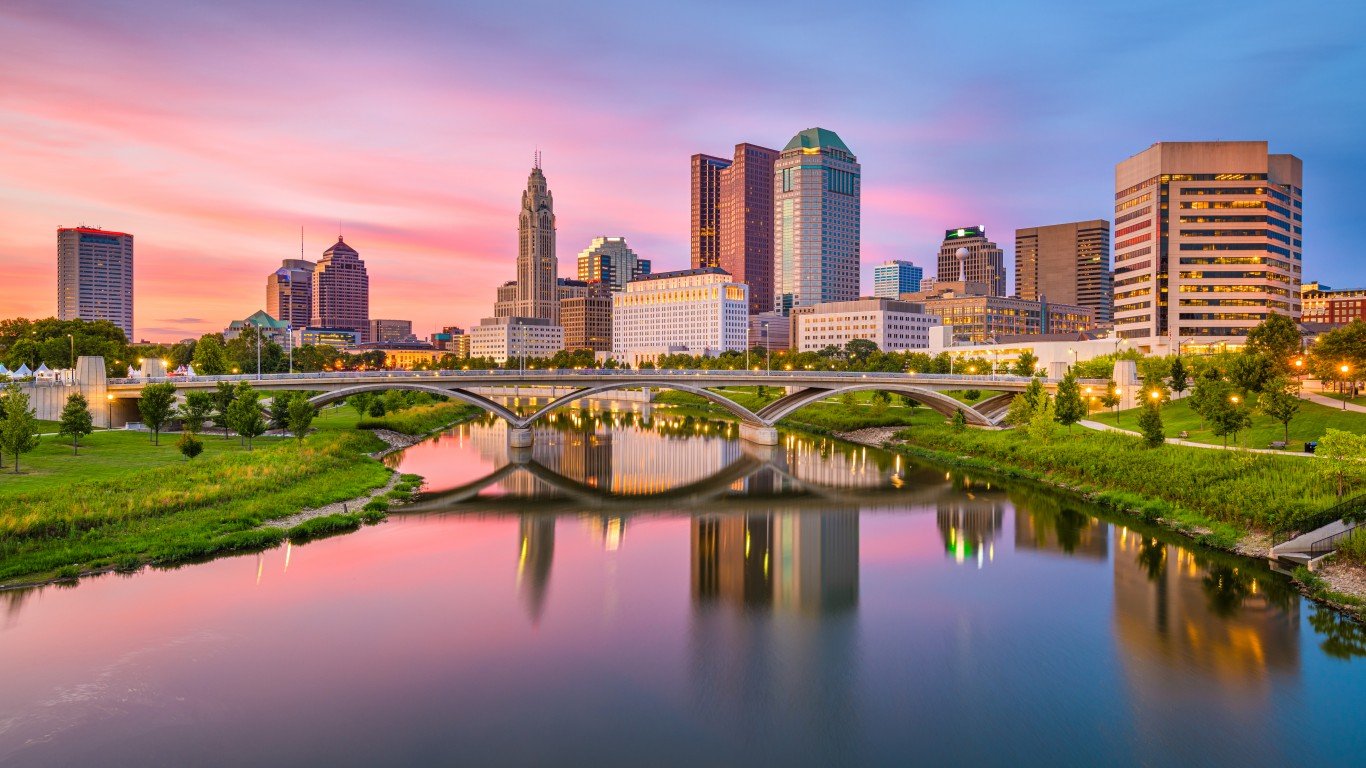
16. Columbus, OH
> Time lost in traffic each year: 29 hours
> Average congestion level, 2021: 13%
> World rank: #379 worst congestion
> Population: 889,079
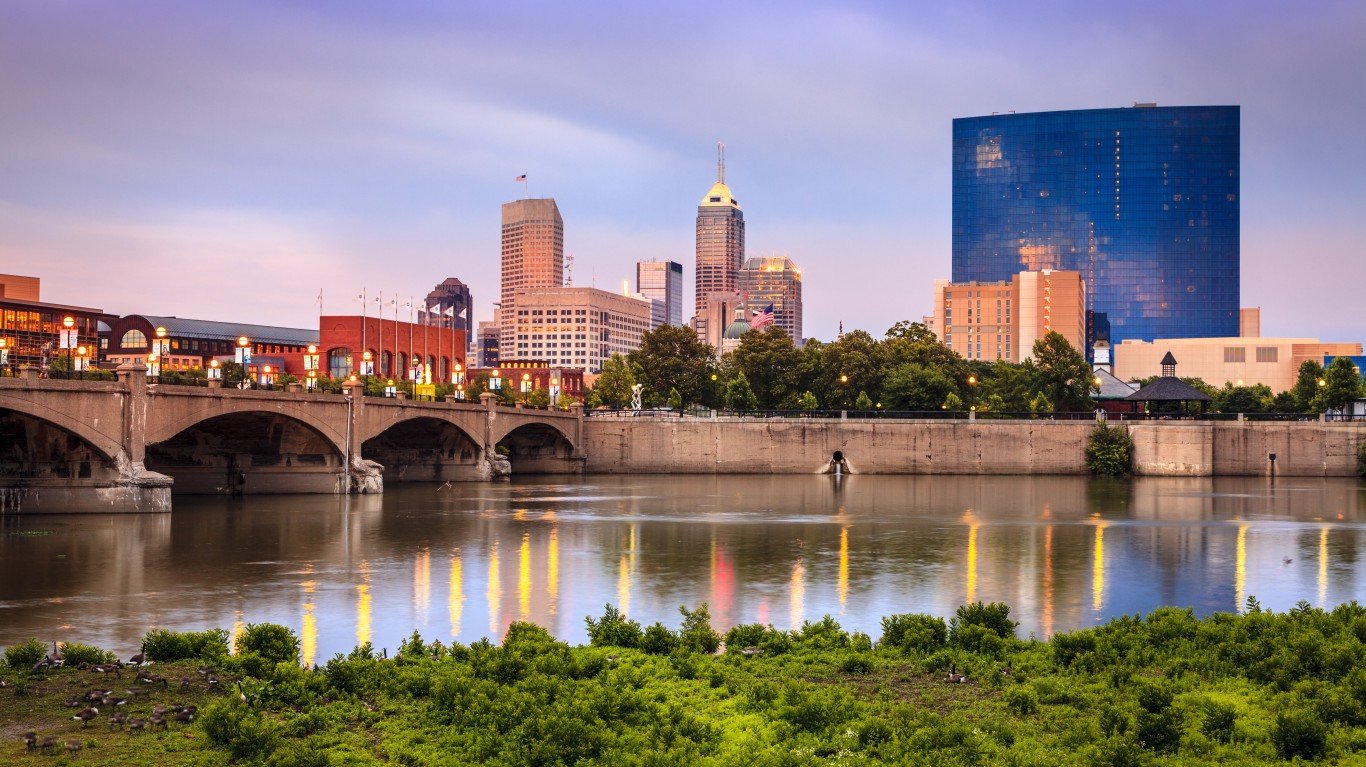
15. Indianapolis, IN
> Time lost in traffic each year: 27 hours
> Average congestion level, 2021: 12%
> World rank: #384 worst congestion
> Population: 869,387
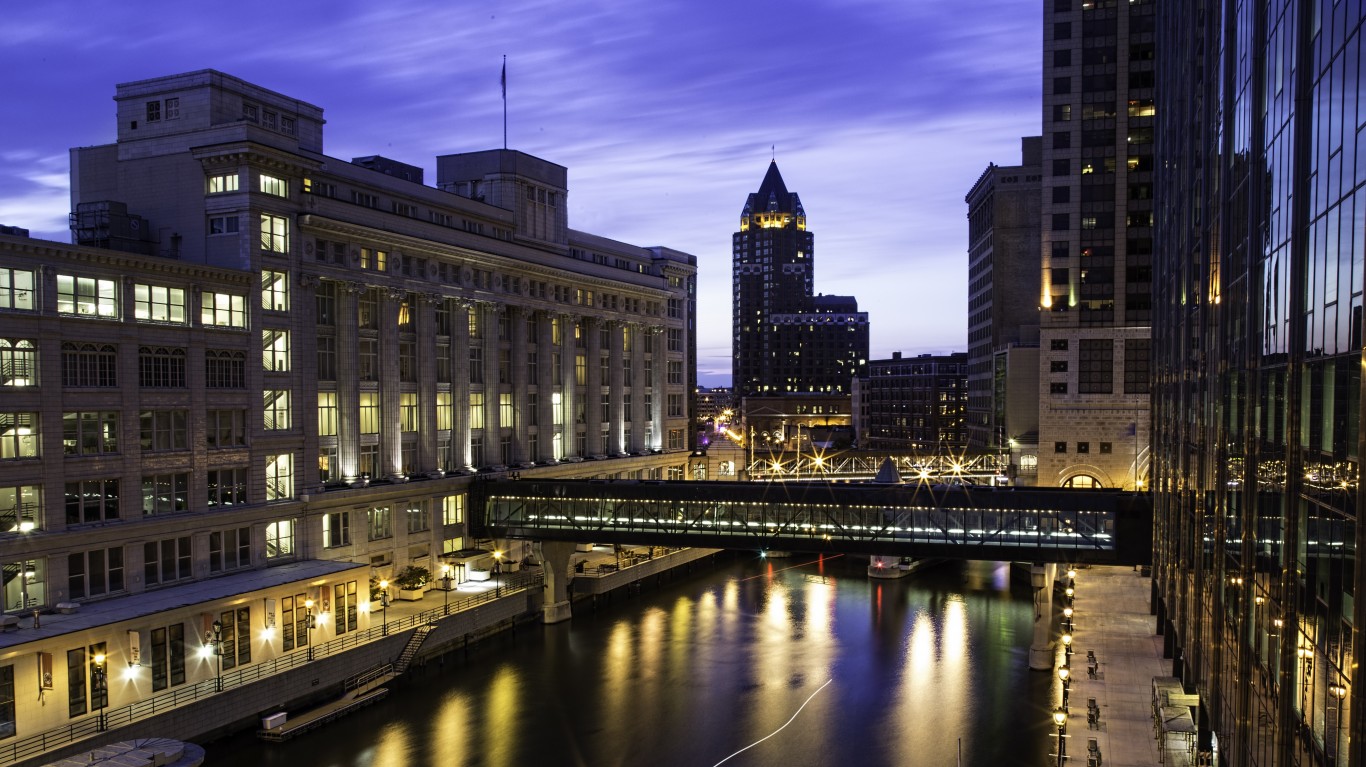
14. Milwaukee, WI
> Time lost in traffic each year: 25 hours
> Average congestion level, 2021: 11%
> World rank: #386 worst congestion
> Population: 592,649
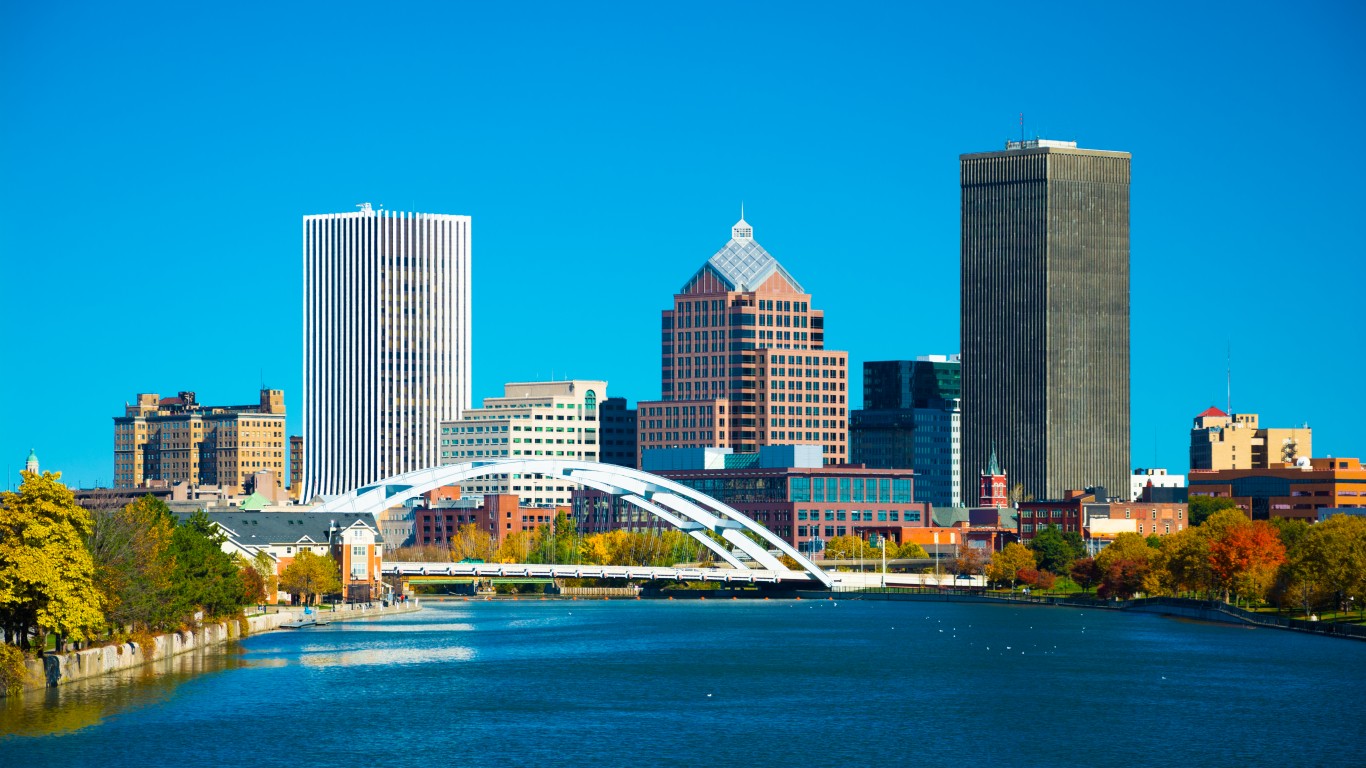
13. Rochester, NY
> Time lost in traffic each year: 25 hours
> Average congestion level, 2021: 11%
> World rank: #387 worst congestion
> Population: 206,357

12. Albany, NY
> Time lost in traffic each year: 25 hours
> Average congestion level, 2021: 11%
> World rank: #390 worst congestion
> Population: 96,860
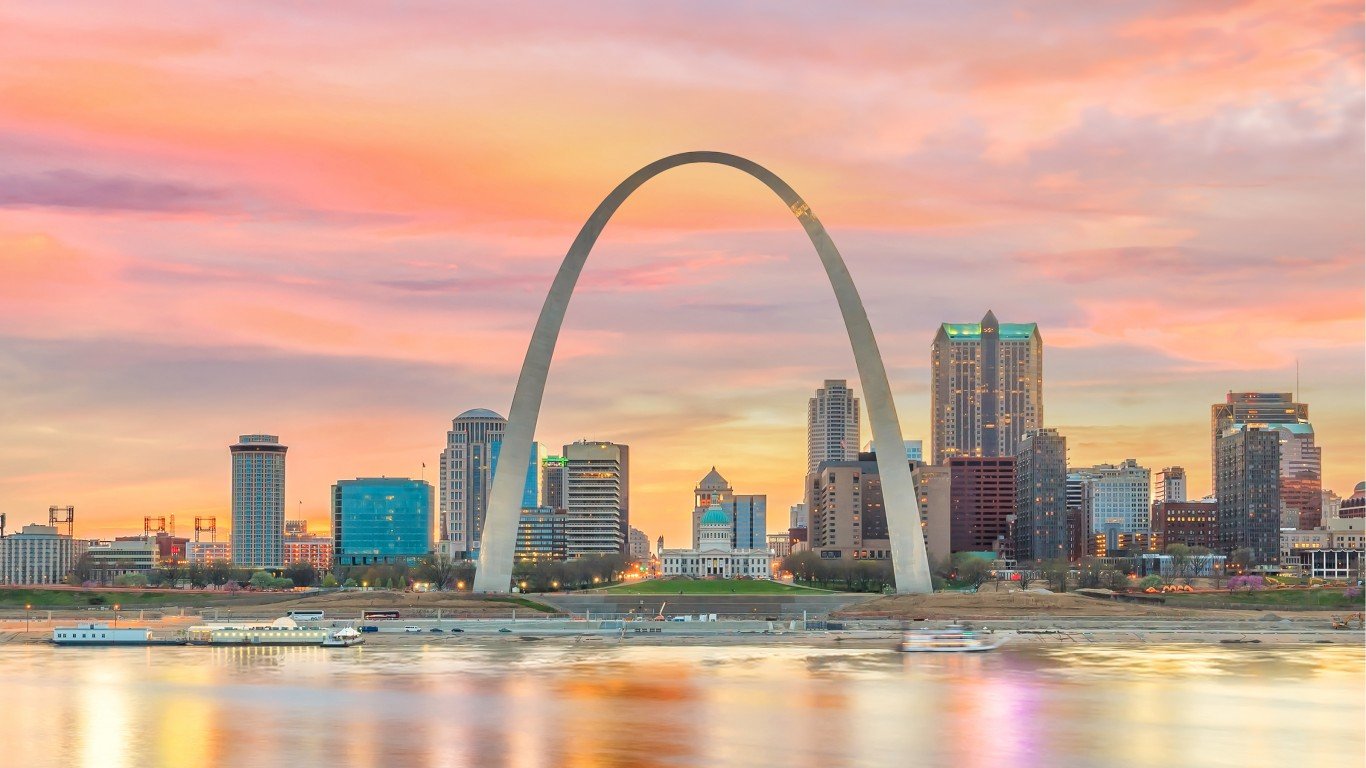
11. St. Louis, MO
> Time lost in traffic each year: 25 hours
> Average congestion level, 2021: 11%
> World rank: #391 worst congestion
> Population: 304,709
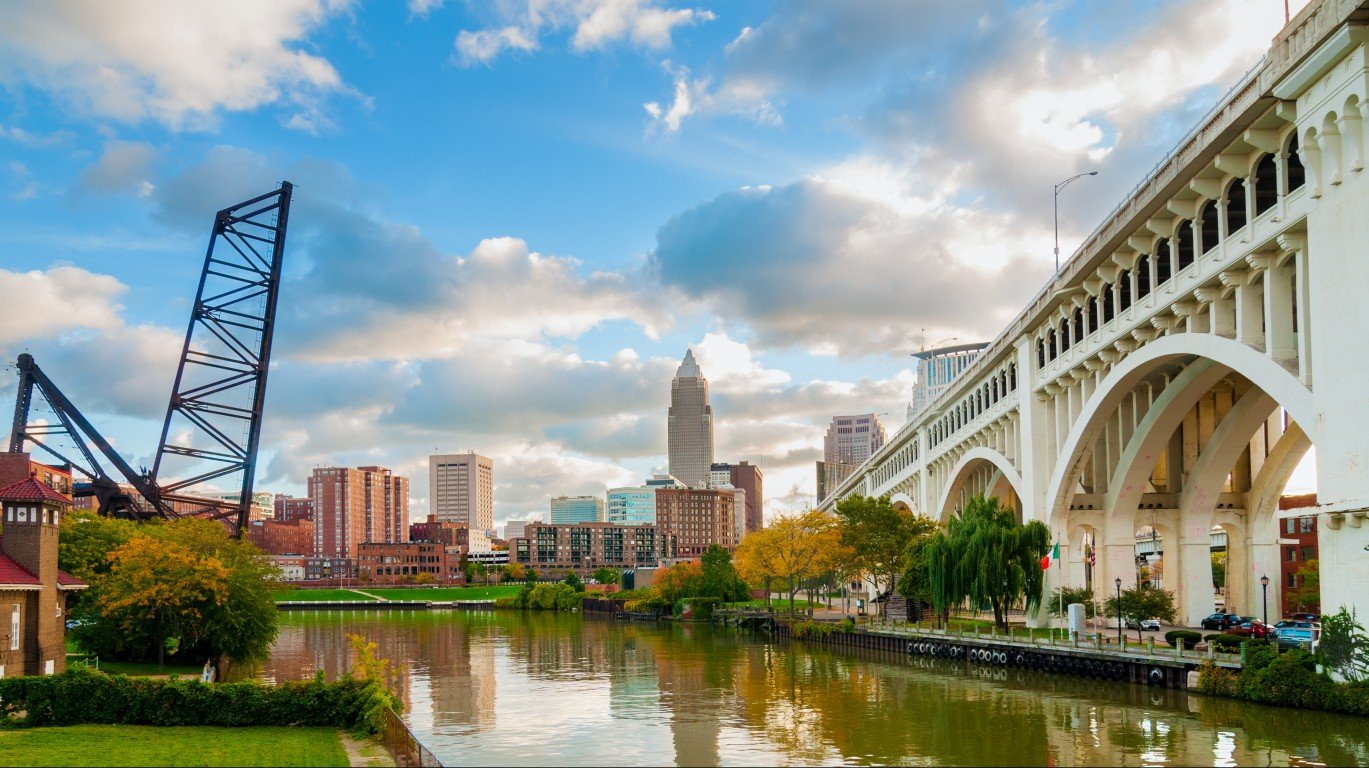
10. Cleveland, OH
> Time lost in traffic each year: 23 hours
> Average congestion level, 2021: 10%
> World rank: #393 worst congestion
> Population: 383,331
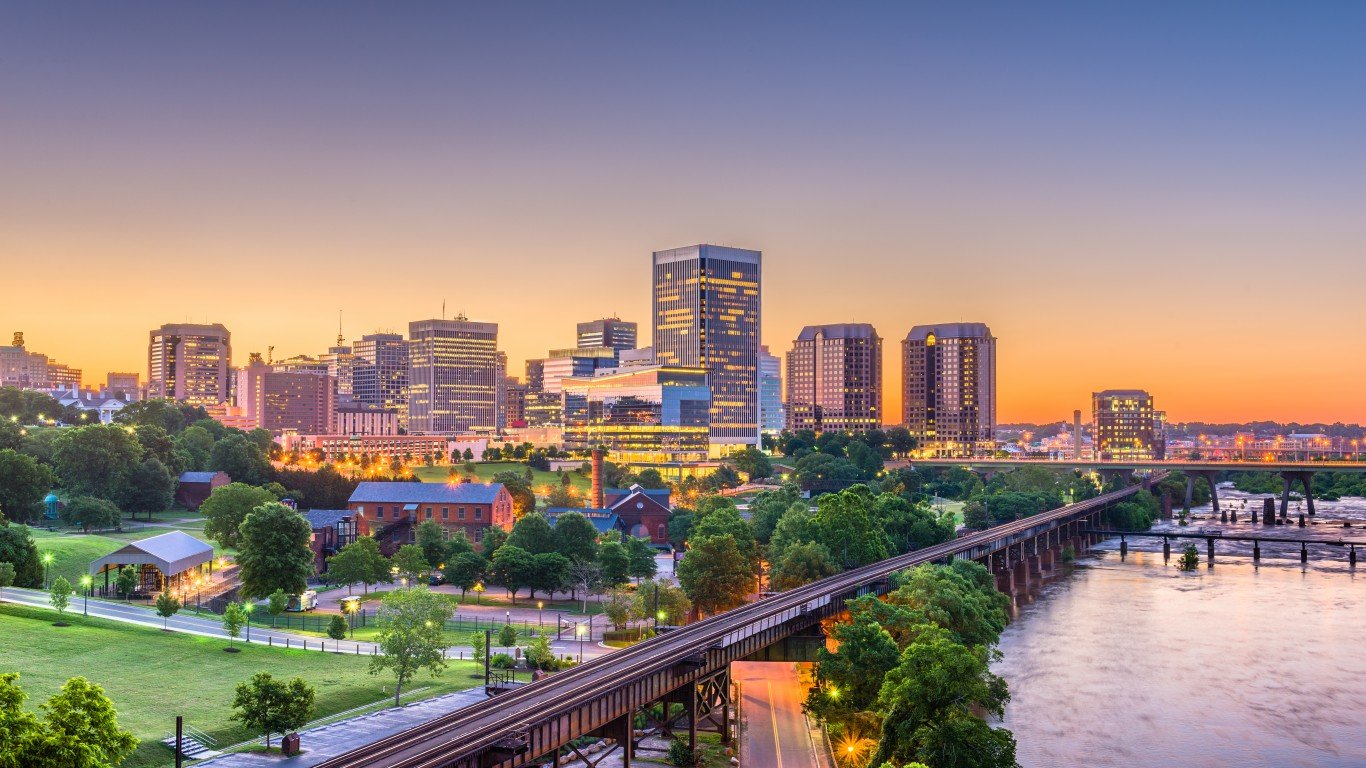
9. Richmond, VA
> Time lost in traffic each year: 23 hours
> Average congestion level, 2021: 10%
> World rank: #394 worst congestion
> Population: 229,233
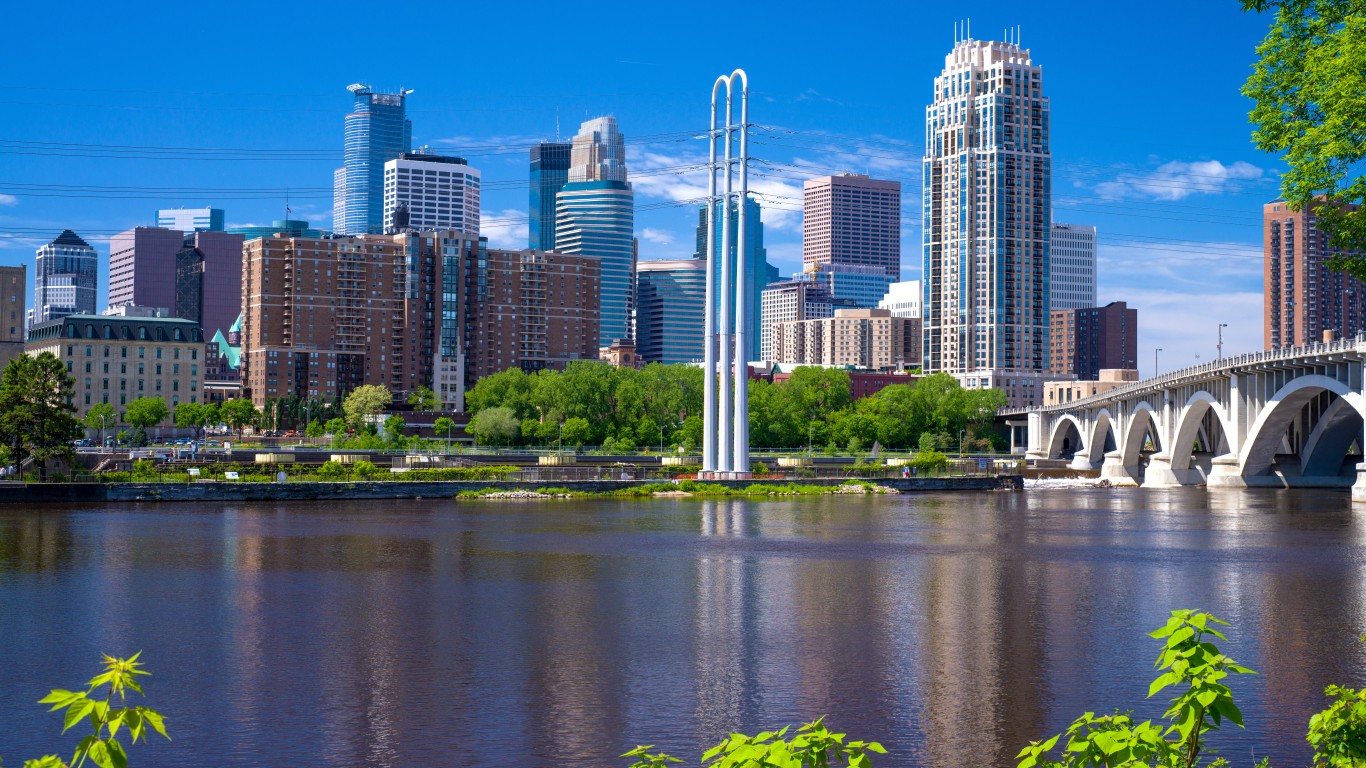
8. Minneapolis, MN
> Time lost in traffic each year: 23 hours
> Average congestion level, 2021: 10%
> World rank: #395 worst congestion
> Population: 424,536
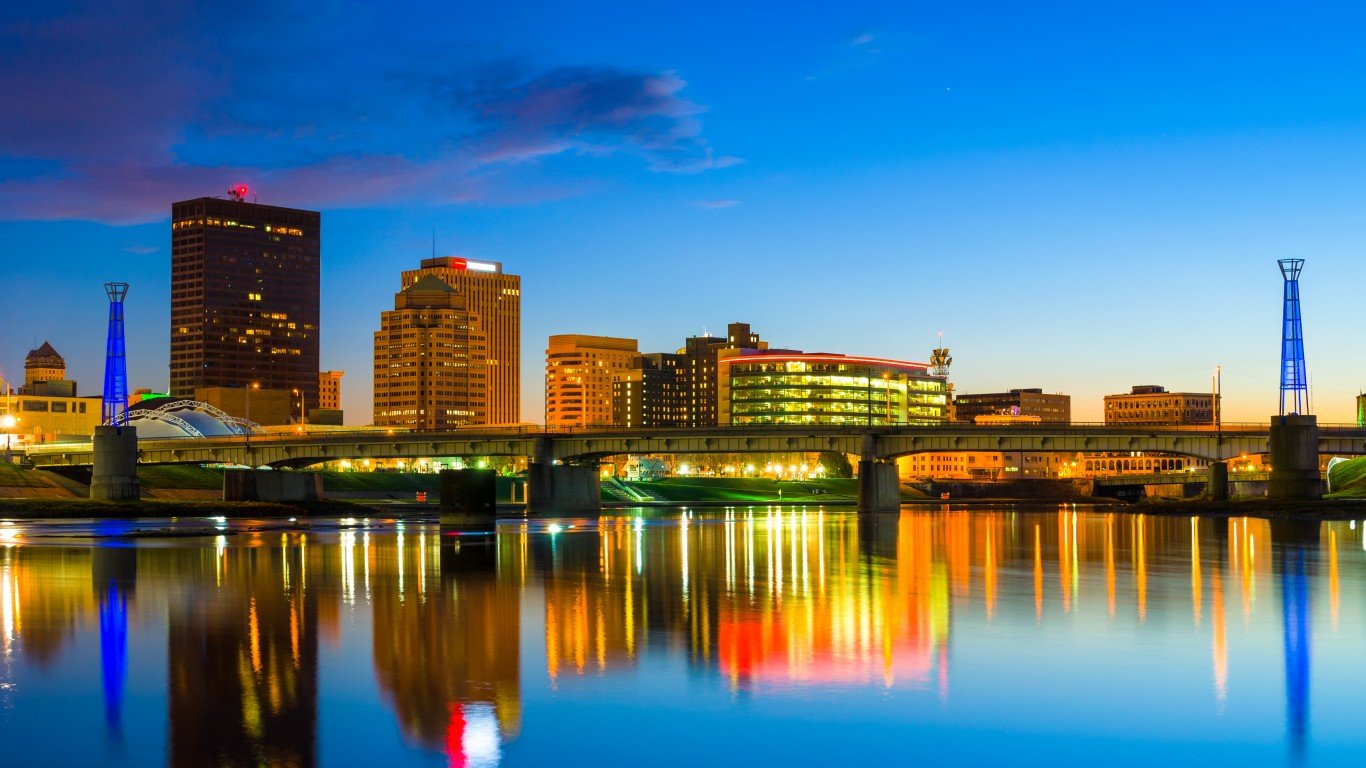
7. Dayton, OH
> Time lost in traffic each year: 23 hours
> Average congestion level, 2021: 10%
> World rank: #397 worst congestion
> Population: 140,444

6. Kansas City, MO
> Time lost in traffic each year: 23 hours
> Average congestion level, 2021: 10%
> World rank: #398 worst congestion
> Population: 491,158

5. Little Rock, AK
> Time lost in traffic each year: 23 hours
> Average congestion level, 2021: 10%
> World rank: #399 worst congestion
> Population: 198,067
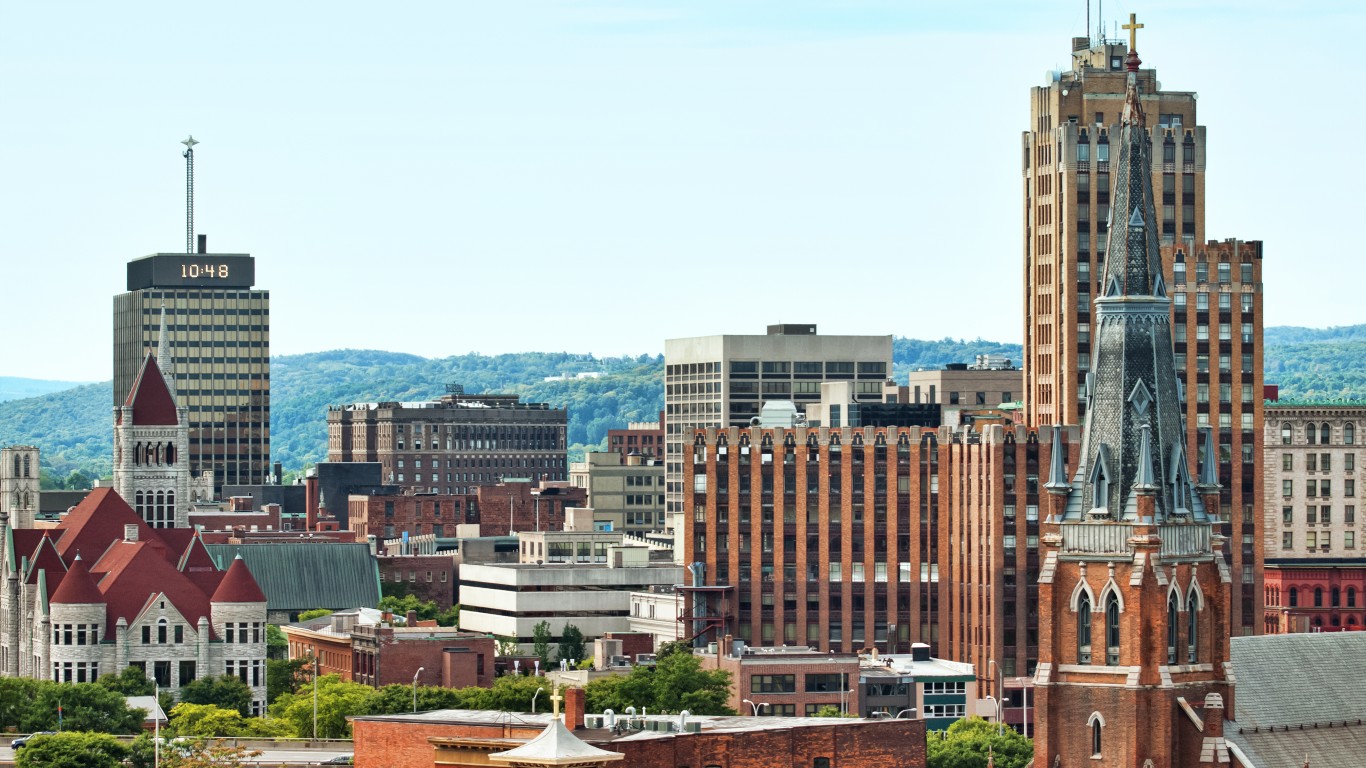
4. Syracuse, NY
> Time lost in traffic each year: 23 hours
> Average congestion level, 2021: 10%
> World rank: #400 worst congestion
> Population: 142,553
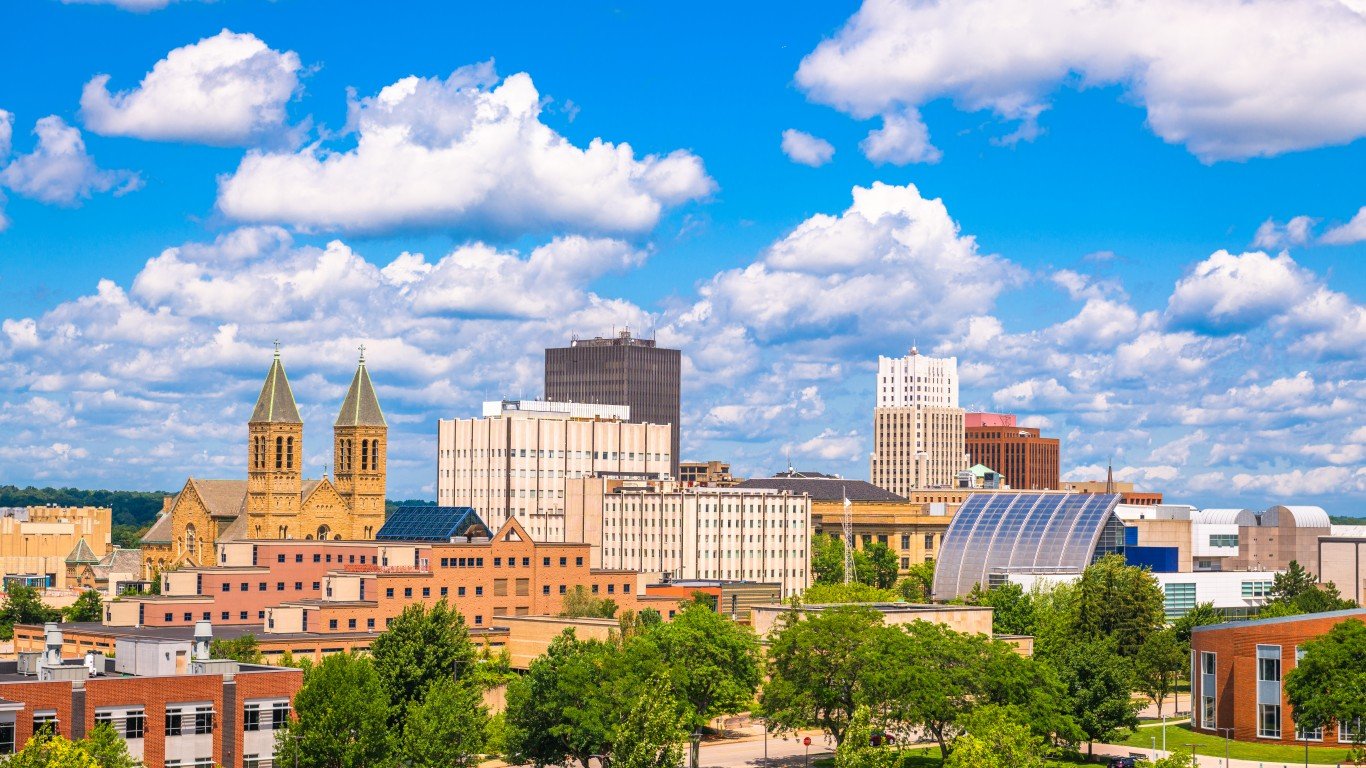
3. Akron, OH
> Time lost in traffic each year: 23 hours
> Average congestion level, 2021: 10%
> World rank: #401 worst congestion
> Population: 197,375
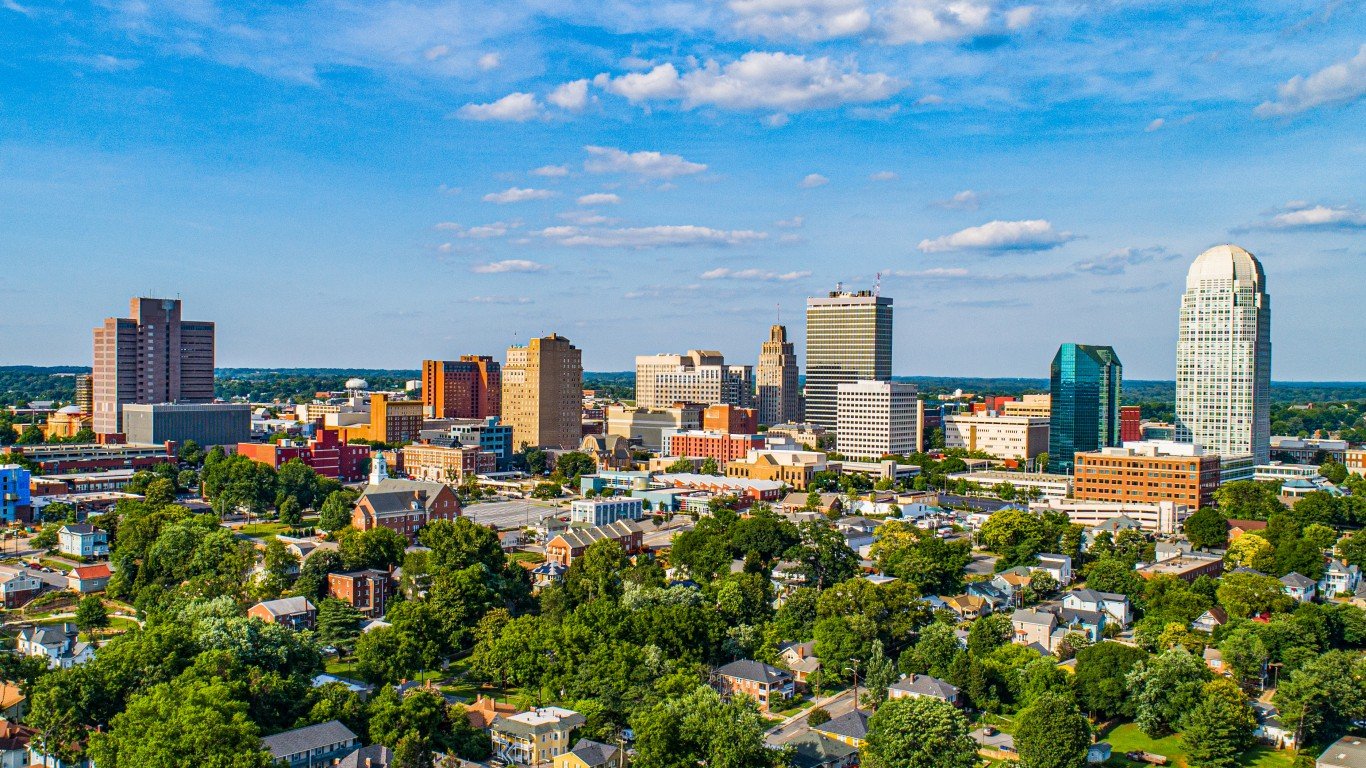
2. Winston-Salem, NC
> Time lost in traffic each year: 20 hours
> Average congestion level, 2021: 9%
> World rank: #402 worst congestion
> Population: 245,787
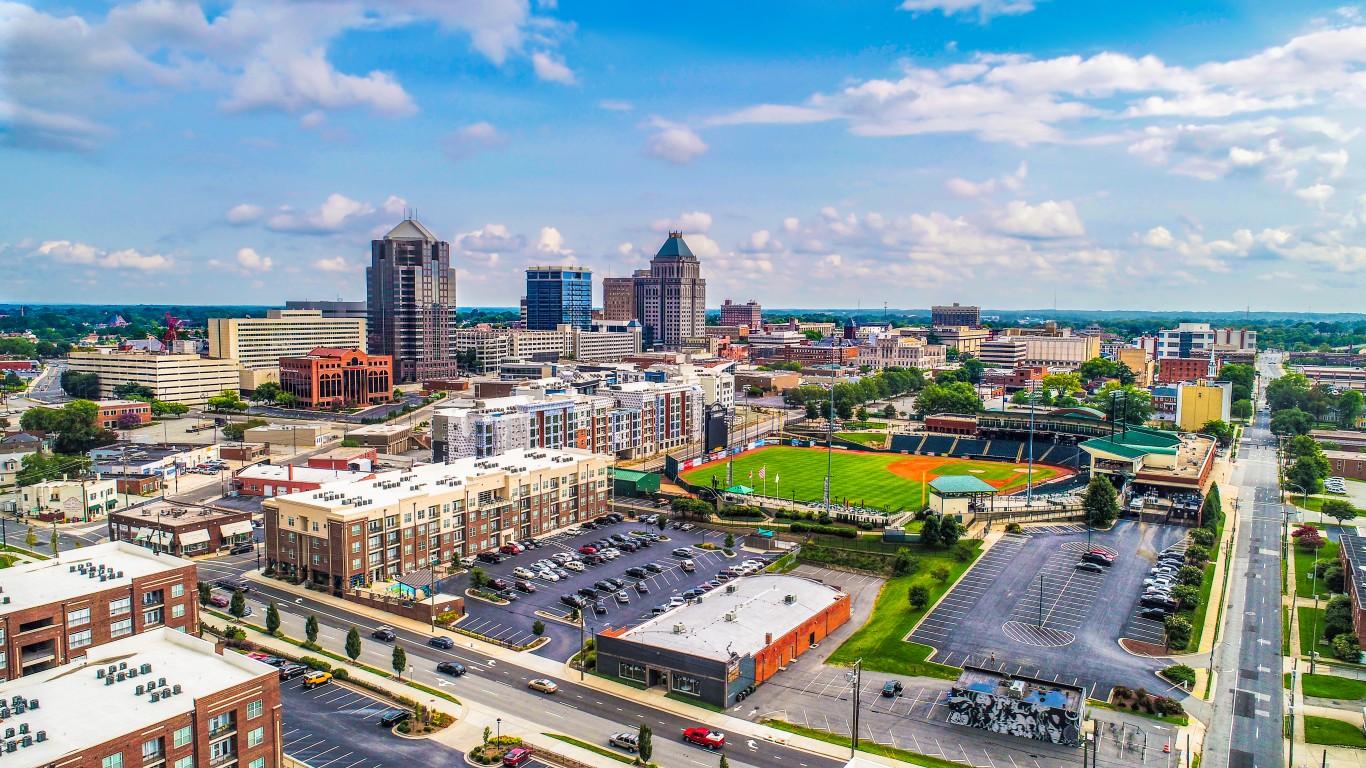
1. Greensboro-High Point, NC
> Time lost in traffic each year: 18 hours
> Average congestion level, 2021: 8%
> World rank: #403 worst congestion
> Population: 294,395