Measuring smarts is no easy feat — but schools across the country certainly try. American high school students, depending on the state, may take over 100 standardized tests before they graduate. These assessments help education officials gauge students’ abilities at certain grade levels across school districts and across states.
Proponents of standardized testing argue that these tests can encourage schools to improve, and can accurately predict a student’s chances for academic success in the future. Critics argue that such tests unfairly discriminate against non-English speakers and are not comprehensive enough in their assessment of student abilities.
Standardized testing remains a major component of the U.S. public education system, culminating in standardized tests that can be used in college admissions, such as ACT and SAT. Typically these tests are second in importance only to GPA in the college admissions process. And some schools appear better equipped to prepare students for success on standardized tests than others.
Using average SAT and ACT test scores from school data clearinghouse Niche, as well as the percentages of high school students who are proficient in math and reading on state assessments from the U.S. Department of Education, 24/7 Wall St. identified the 50 smartest public high schools in the United States.
We only considered the schools that rank in Niche’s top 300 public high schools. It is important to note that the schools on this list are numbered in alphabetical order by city and are not ranked. Smaller schools are at greater risk of large annual fluctuations in test scores, and therefore we only considered schools with an enrollment of over 500 in our analysis.
This list was formulated strictly on the basis of student test performance. It does not take into account other measures that are commonly used to gauge the quality of an education system, like Advanced Placement enrollment and graduation rates. Here is a look at the cities where the most people graduate high school.

1. Thomas Jefferson High For Science And Technology, Alexandria, VA
> Avg. SAT score: 1510
> Avg. ACT score: 34
> Proficiency on state-administered tests: 99% (math); 99% (reading)
> Total enrollment: 1,789

2. International Academy, Bloomfield Hills, MI
> Avg. SAT score: 1390
> Avg. ACT score: 32
> Proficiency on state-administered tests: 97% (math); 99% (reading)
> Total enrollment: 1,557
3. Bronx High School Of Science, Bronx, NY
> Avg. SAT score: 1420
> Avg. ACT score: 32
> Proficiency on state-administered tests: 99% (math); 99% (reading)
> Total enrollment: 2,977

4. Brooklyn Technical High School, Brooklyn, NY
> Avg. SAT score: 1360
> Avg. ACT score: 31
> Proficiency on state-administered tests: 99% (math); 99% (reading)
> Total enrollment: 5,664

5. Whitney (Gretchen) High, Cerritos, CA
> Avg. SAT score: 1400
> Avg. ACT score: 32
> Proficiency on state-administered tests: 96% (math); 99% (reading)
> Total enrollment: 1,011

6. BASIS Chandler, Chandler, AZ
> Avg. SAT score: 1470
> Avg. ACT score: 33
> Proficiency on state-administered tests: 97% (math); 89% (reading)
> Total enrollment: 897

7. Northside College Preparatory Hs, Chicago, IL
> Avg. SAT score: 1370
> Avg. ACT score: 31
> Proficiency on state-administered tests: 89% (math); 94% (reading)
> Total enrollment: 1,069

8. Payton College Preparatory Hs, Chicago, IL
> Avg. SAT score: 1390
> Avg. ACT score: 31
> Proficiency on state-administered tests: 95% (math); 97% (reading)
> Total enrollment: 977
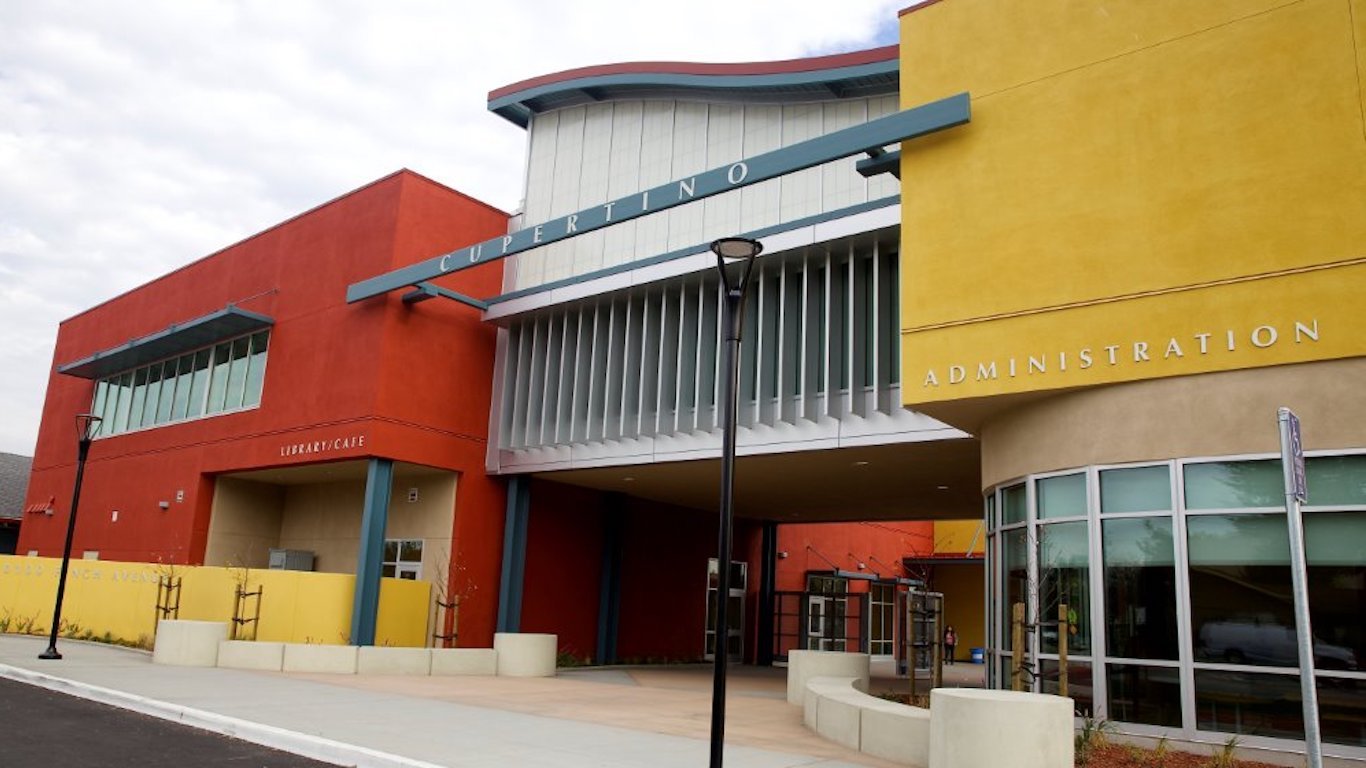
9. Cupertino High, Cupertino, CA
> Avg. SAT score: 1380
> Avg. ACT score: 31
> Proficiency on state-administered tests: 84% (math); 90% (reading)
> Total enrollment: 2,315

10. Monta Vista High, Cupertino, CA
> Avg. SAT score: 1430
> Avg. ACT score: 33
> Proficiency on state-administered tests: 90% (math); 94% (reading)
> Total enrollment: 2,334

11. Oxford Academy, Cypress, CA
> Avg. SAT score: 1380
> Avg. ACT score: 32
> Proficiency on state-administered tests: 94% (math); 99% (reading)
> Total enrollment: 1,204

12. BASIS Flagstaff, Flagstaff, AZ
> Avg. SAT score: 1370
> Avg. ACT score: 31
> Proficiency on state-administered tests: 83% (math); 80% (reading)
> Total enrollment: 640
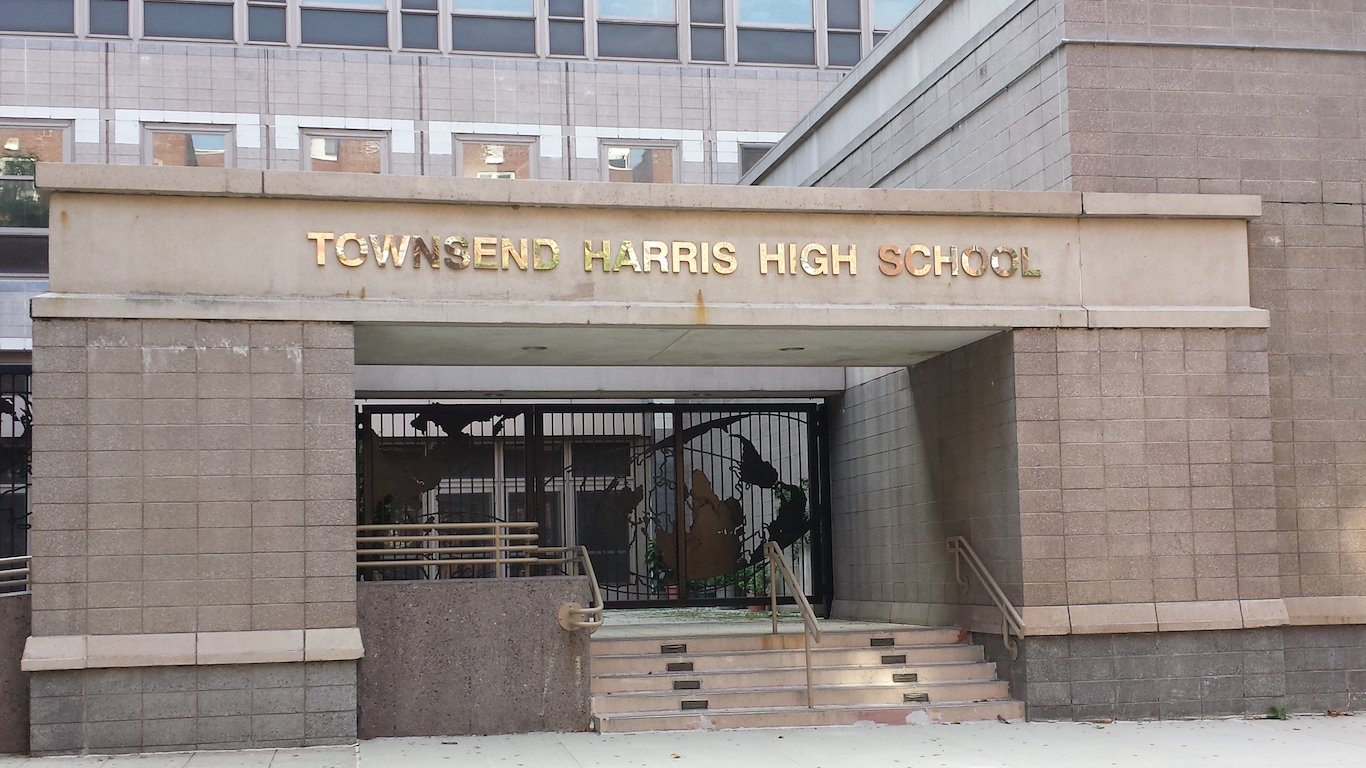
13. Townsend Harris High School, Flushing, NY
> Avg. SAT score: 1380
> Avg. ACT score: 31
> Proficiency on state-administered tests: 99% (math); 99% (reading)
> Total enrollment: 1,109

14. Troy High, Fullerton, CA
> Avg. SAT score: 1380
> Avg. ACT score: 31
> Proficiency on state-administered tests: 77% (math); 86% (reading)
> Total enrollment: 2,680

15. Bergen County Academies, Hackensack, NJ
> Avg. SAT score: 1460
> Avg. ACT score: 33
> Proficiency on state-administered tests: 99% (math); 94% (reading)
> Total enrollment: 1,069

16. Merrol Hyde Magnet School, Hendersonville, TN
> Avg. SAT score: 1370
> Avg. ACT score: 31
> Proficiency on state-administered tests: 95% (math); 92% (reading)
> Total enrollment: 660

17. Debakey H S For Health Prof, Houston, TX
> Avg. SAT score: 1360
> Avg. ACT score: 31
> Proficiency on state-administered tests: 95% (math); 99% (reading)
> Total enrollment: 852

18. Northwood High, Irvine, CA
> Avg. SAT score: 1370
> Avg. ACT score: 31
> Proficiency on state-administered tests: 81% (math); 88% (reading)
> Total enrollment: 2,237

19. University High, Irvine, CA
> Avg. SAT score: 1380
> Avg. ACT score: 31
> Proficiency on state-administered tests: 74% (math); 83% (reading)
> Total enrollment: 2,558

20. Gwinnett School Of Mathematics- Science And Technology, Lawrenceville, GA
> Avg. SAT score: 1360
> Avg. ACT score: 31
> Proficiency on state-administered tests: 99% (math); 95% (reading)
> Total enrollment: 979

21. Lexington High, Lexington, MA
> Avg. SAT score: 1370
> Avg. ACT score: 31
> Proficiency on state-administered tests: 98% (math); 99% (reading)
> Total enrollment: 2,185
22. Haynes Academy School For Advanced Studies, Metairie, LA
> Avg. SAT score: 1420
> Avg. ACT score: 30
> Proficiency on state-administered tests: 99% (math); 99% (reading)
> Total enrollment: 810

23. Central Magnet School, Murfreesboro, TN
> Avg. SAT score: 1410
> Avg. ACT score: 31
> Proficiency on state-administered tests: 97% (math); 99% (reading)
> Total enrollment: 1,236

24. Stuyvesant High School, New York, NY
> Avg. SAT score: 1470
> Avg. ACT score: 33
> Proficiency on state-administered tests: 99% (math); 99% (reading)
> Total enrollment: 3,368

25. Northville High School, Northville, MI
> Avg. SAT score: 1360
> Avg. ACT score: 31
> Proficiency on state-administered tests: 77% (math); 92% (reading)
> Total enrollment: 2,372

26. BASIS Oro Valley, Oro Valley, AZ
> Avg. SAT score: 1370
> Avg. ACT score: 31
> Proficiency on state-administered tests: 94% (math); 93% (reading)
> Total enrollment: 571

27. Pine View School, Osprey, FL
> Avg. SAT score: 1370
> Avg. ACT score: 31
> Proficiency on state-administered tests: 99% (math); 99% (reading)
> Total enrollment: 2,051

28. Henry M. Gunn High, Palo Alto, CA
> Avg. SAT score: 1410
> Avg. ACT score: 32
> Proficiency on state-administered tests: 72% (math); 82% (reading)
> Total enrollment: 1,919

29. Palo Alto High, Palo Alto, CA
> Avg. SAT score: 1370
> Avg. ACT score: 31
> Proficiency on state-administered tests: 72% (math); 87% (reading)
> Total enrollment: 1,992

30. BASIS Peoria, Peoria, AZ
> Avg. SAT score: 1410
> Avg. ACT score: 32
> Proficiency on state-administered tests: 94% (math); 87% (reading)
> Total enrollment: 772

31. Masterman Julia R Sec Sch, Philadelphia, PA
> Avg. SAT score: 1370
> Avg. ACT score: 31
> Proficiency on state-administered tests: 97% (math); 99% (reading)
> Total enrollment: 1,190
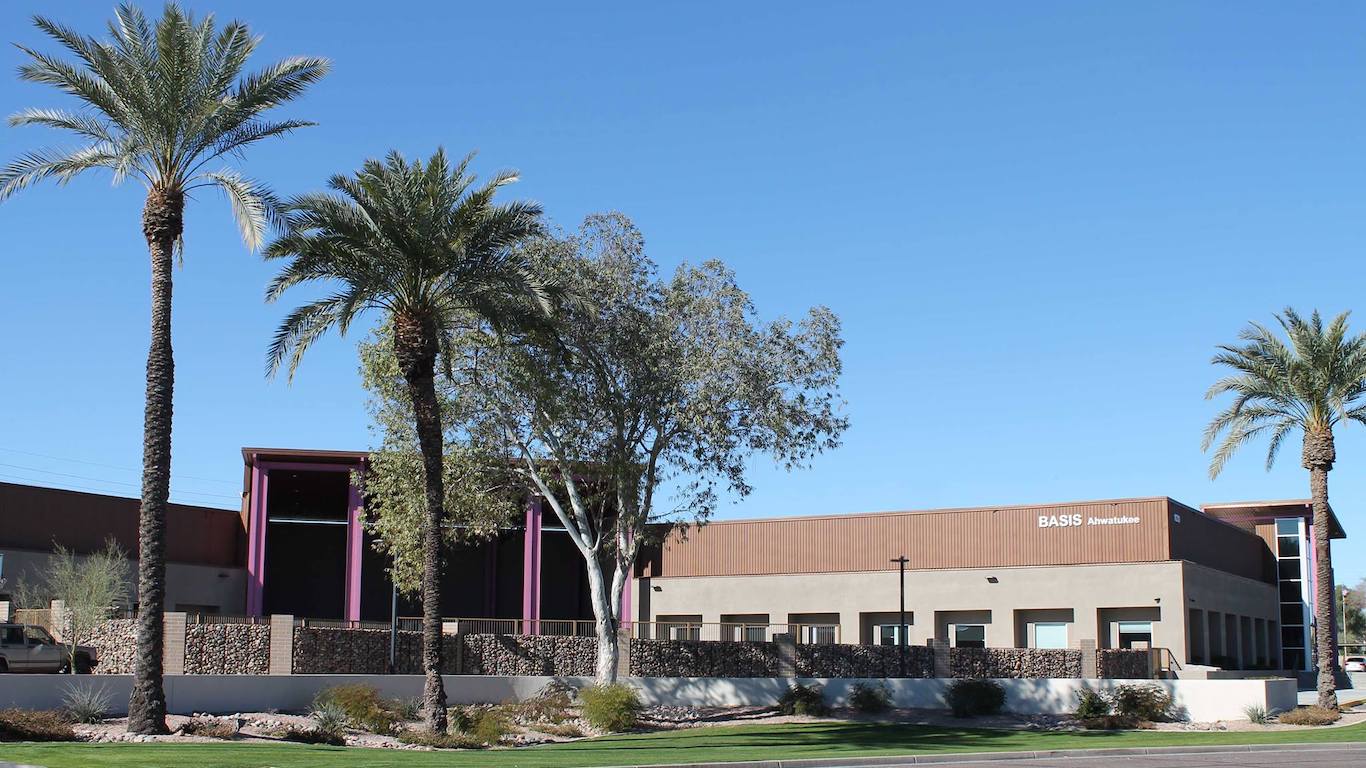
32. BASIS Ahwatukee, Phoenix, AZ
> Avg. SAT score: 1430
> Avg. ACT score: 32
> Proficiency on state-administered tests: 87% (math); 80% (reading)
> Total enrollment: 755

33. BASIS Phoenix, Phoenix, AZ
> Avg. SAT score: 1400
> Avg. ACT score: 32
> Proficiency on state-administered tests: 90% (math); 85% (reading)
> Total enrollment: 781
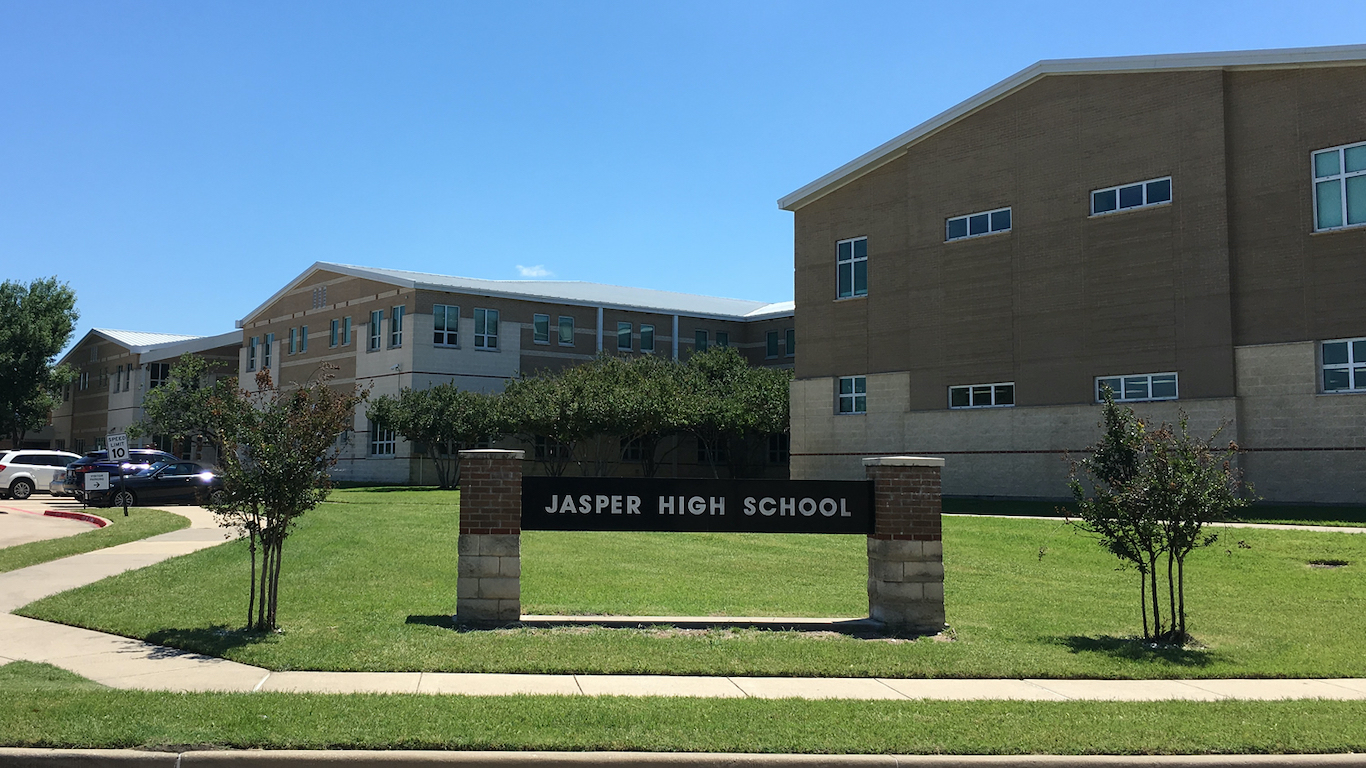
34. Jasper H S, Plano, TX
> Avg. SAT score: 1400
> Avg. ACT score: 32
> Proficiency on state-administered tests: 91% (math); 94% (reading)
> Total enrollment: 1,452
35. Poolesville High, Poolesville, MD
> Avg. SAT score: 1400
> Avg. ACT score: 31
> Proficiency on state-administered tests: 95% (math); 72% (reading)
> Total enrollment: 1,180
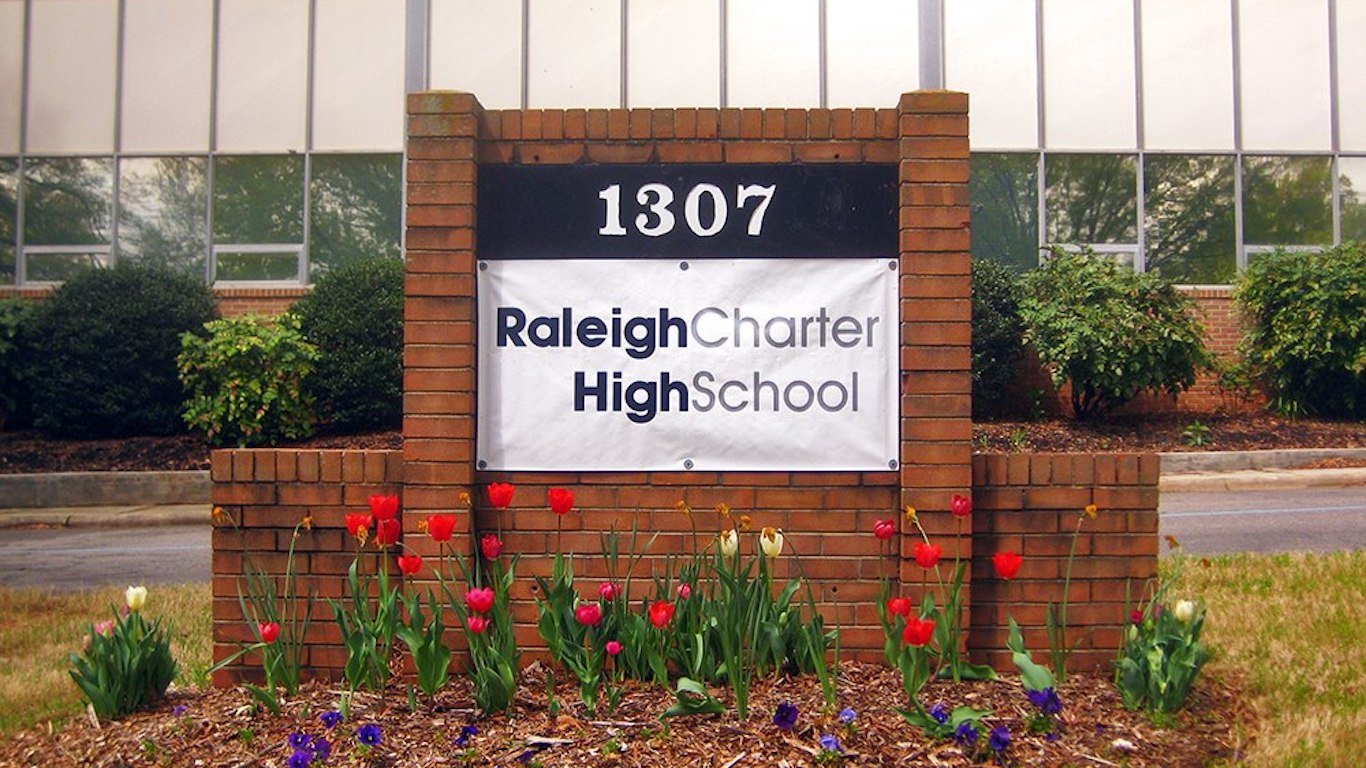
36. Raleigh Charter High School, Raleigh, NC
> Avg. SAT score: 1380
> Avg. ACT score: 31
> Proficiency on state-administered tests: 92% (math); 95% (reading)
> Total enrollment: 562

37. Tesla Stem High School, Redmond, WA
> Avg. SAT score: 1430
> Avg. ACT score: 33
> Proficiency on state-administered tests: 95% (math); 95% (reading)
> Total enrollment: 578

38. Roslyn High School, Roslyn Heights, NY
> Avg. SAT score: 1350
> Avg. ACT score: 31
> Proficiency on state-administered tests: 98% (math); 99% (reading)
> Total enrollment: 1,066

39. Canyon Crest Academy, San Diego, CA
> Avg. SAT score: 1380
> Avg. ACT score: 31
> Proficiency on state-administered tests: 76% (math); 87% (reading)
> Total enrollment: 2,406
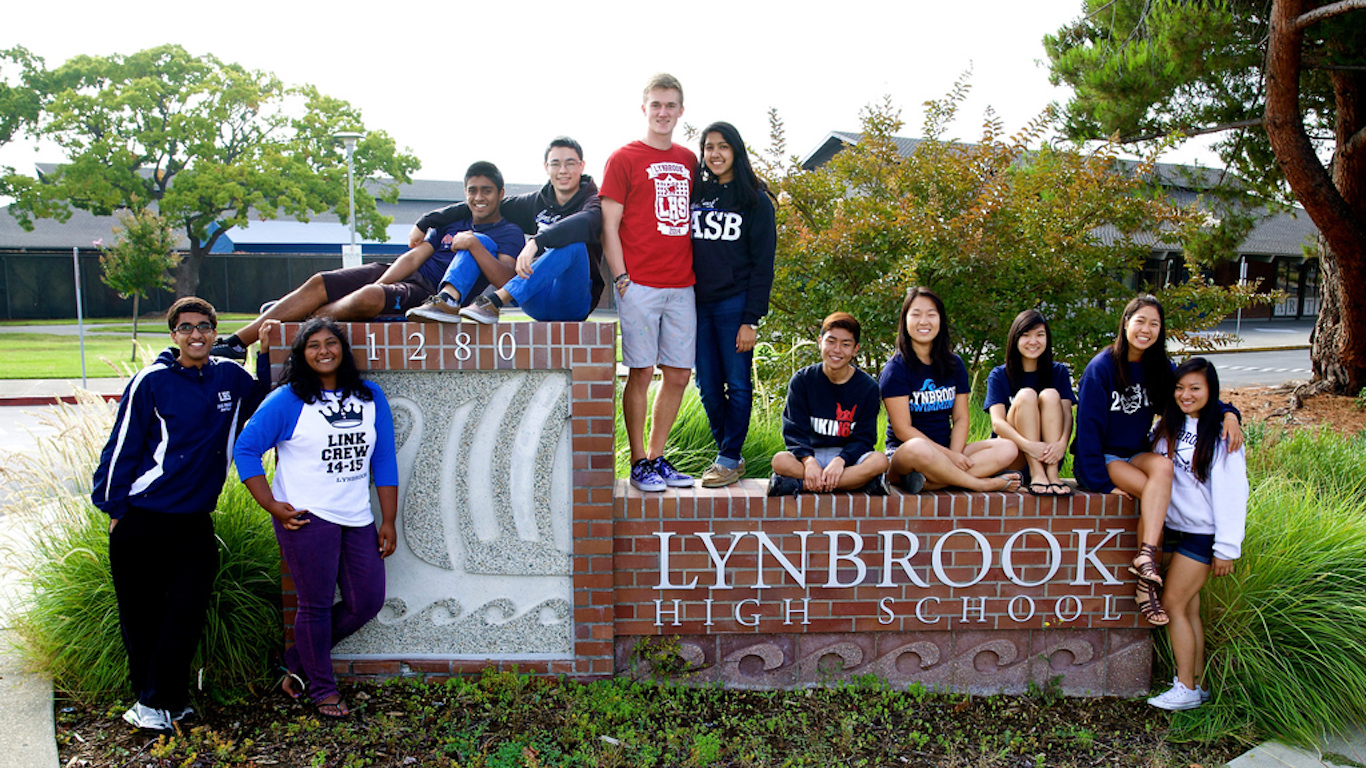
40. Lynbrook High, San Jose, CA
> Avg. SAT score: 1440
> Avg. ACT score: 32
> Proficiency on state-administered tests: 91% (math); 93% (reading)
> Total enrollment: 1,766

41. San Marino High, San Marino, CA
> Avg. SAT score: 1360
> Avg. ACT score: 31
> Proficiency on state-administered tests: 81% (math); 85% (reading)
> Total enrollment: 1,119

42. Dougherty Valley High, San Ramon, CA
> Avg. SAT score: 1380
> Avg. ACT score: 31
> Proficiency on state-administered tests: 85% (math); 95% (reading)
> Total enrollment: 2,998

43. Saratoga High, Saratoga, CA
> Avg. SAT score: 1420
> Avg. ACT score: 32
> Proficiency on state-administered tests: 83% (math); 86% (reading)
> Total enrollment: 1,358
44. Scarsdale Senior High School, Scarsdale, NY
> Avg. SAT score: 1380
> Avg. ACT score: 31
> Proficiency on state-administered tests: 99% (math); 99% (reading)
> Total enrollment: 1,517

45. BASIS Scottsdale, Scottsdale, AZ
> Avg. SAT score: 1470
> Avg. ACT score: 33
> Proficiency on state-administered tests: 92% (math); 88% (reading)
> Total enrollment: 1,081

46. Staten Island Technical High School, Staten Island, NY
> Avg. SAT score: 1410
> Avg. ACT score: 32
> Proficiency on state-administered tests: 99% (math); 99% (reading)
> Total enrollment: 1,313

47. Bergen County Technical High School – Teterboro, Teterboro, NJ
> Avg. SAT score: 1350
> Avg. ACT score: 32
> Proficiency on state-administered tests: 90% (math); 92% (reading)
> Total enrollment: 677

48. BASIS Tucson North, Tucson, AZ
> Avg. SAT score: 1430
> Avg. ACT score: 32
> Proficiency on state-administered tests: 90% (math); 83% (reading)
> Total enrollment: 1,063

49. West Lafayette Jr/Sr High School, West Lafayette, IN
> Avg. SAT score: 1350
> Avg. ACT score: 32
> Proficiency on state-administered tests: 78% (math); 85% (reading)
> Total enrollment: 1,117

50. Charter School Of Wilmington, Wilmington, DE
> Avg. SAT score: 1350
> Avg. ACT score: 31
> Proficiency on state-administered tests: 97% (math); 99% (reading)
> Total enrollment: 971
Detailed findings and full methodology
Many of the schools on this list, including the eight BASIS schools in Arizona, are charter schools that emphasize performance on standardized tests. Others are specialized schools, like Stuyvesant High School in New York, and are open only to students who score well enough on an admissions exam, meaning the students may naturally be better test takers and more likely to score well on tests like the ACT or SAT.
While some schools on this list have a selection process and do not simply admit all children who live within the district, every school on this list receives funding through taxpayer dollars. In contrast, some parents spend tens of thousands of dollars a year to send their children to private schools, many of which report standardized test scores on par with the schools on this list. Here is a look at America’s most expensive private high schools.
To determine the 50 smartest public high schools in the United States, 24/7 Wall St. created an index of several measures related to standardized test performance for each of the 300 schools listed on Niche’s 2020 Best Public High Schools in America.
Average SAT and ACT scores came from school ranking and review site Niche and were each included in the index at full weight. The shares of students who ranked as proficient in state assessments in mathematics and the share of students who ranked as proficient in state assessments of reading in the 2016-17 school year came from the U.S. Department of Education and were included in the index at full weight.
Each state administers a different proficiency test, which has different proficiency standards and is administered to various grade levels. The U.S. Department of Education publishes data on the percentage of students who score at or above the state’s proficiency level on their respective exams. While both the content of the tests and their achievement standards vary widely across states and should be compared with caution, the Department of Education recommends utilizing a school’s relation to the state mean or state standards target when comparing proficiency data across states. To compare achievement data across states, the ranking of each school’s proficiency scores within its state were used in the index.
Data on the number of students who pass at least one AP exam as a share of the number of students who took at least one AP exam during the 2013-14 school year came from the Civil Rights Data Collection program of the Department of Education and was included in the index at full weight. Enrollment figures for the 2016-17 school year came from the National Center for Education Statistics of the Department of Education.