
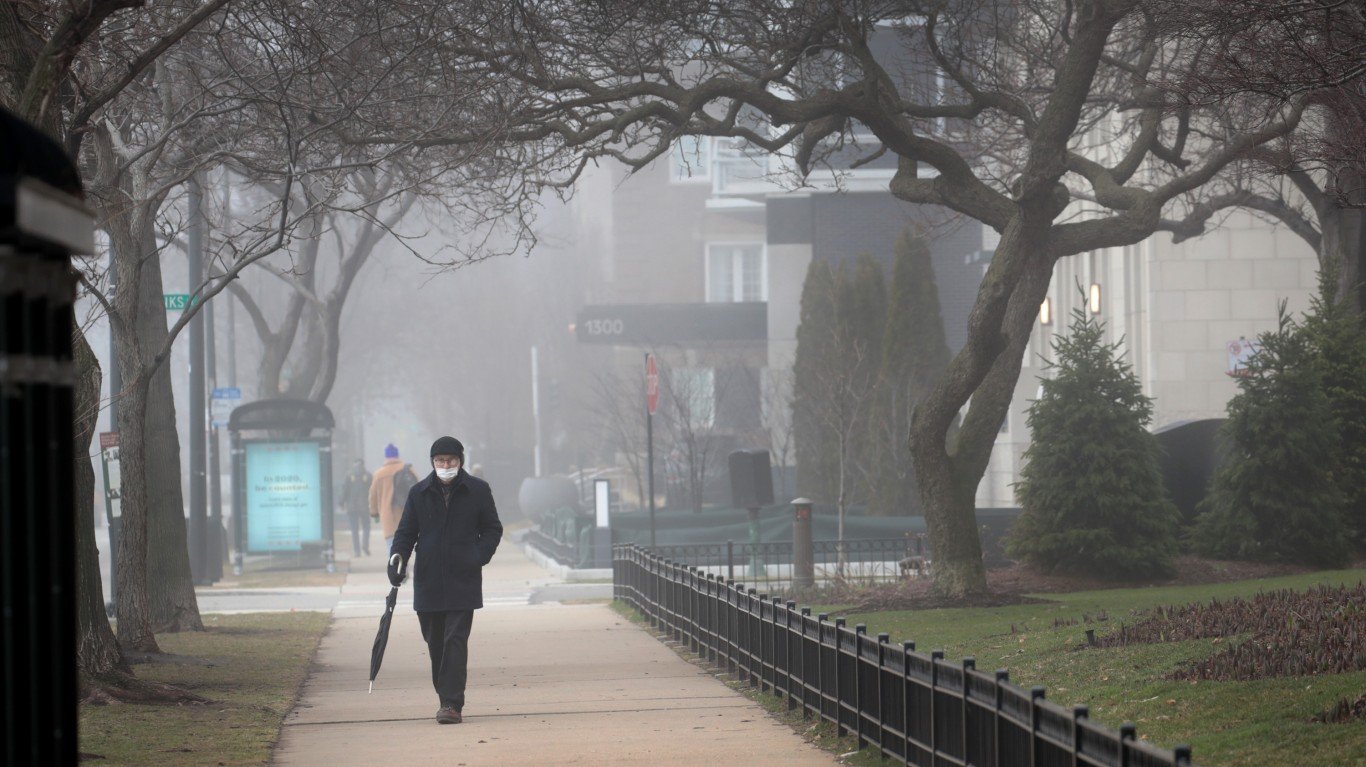
The spread of COVID-19 last December and January was the worst it has been since the start of the pandemic in a number of regions in America. In Los Angeles, the country’s second largest city, one hospital was operating at over three times its ICU bed capacity. In Los Angeles County, COVID-19 killed one person every 15 minutes.
Just a month ago, many Americans believed this holiday would be relatively safe for travel and gatherings. Cases had fallen sharply in summer. And while case counts moved higher once again in September and October, they dropped sharply again in the last several weeks. The new omicron variant of the virus has changed that — in some cases in a matter of days.
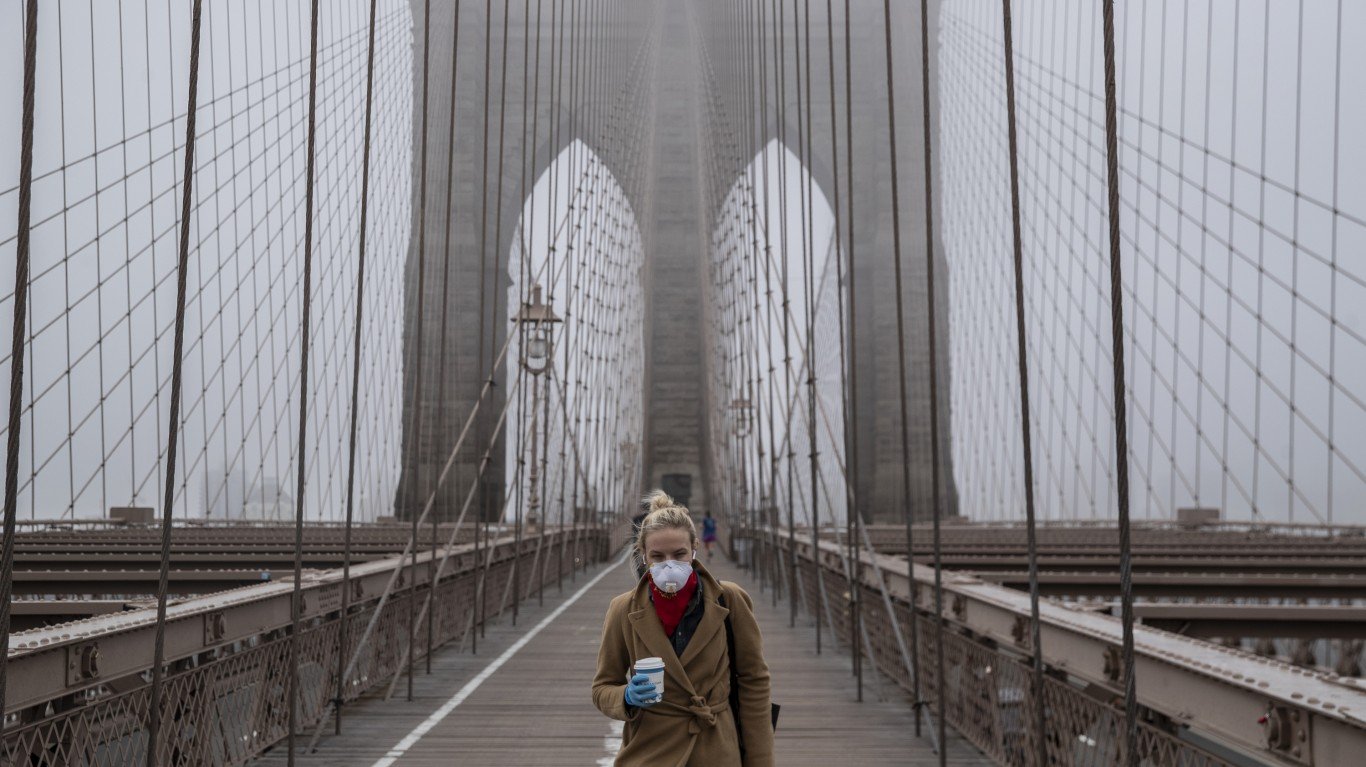
In New York City, now a hot spot for omicron, the positivity rate has almost doubled in three days. This pattern is similar to ones reported in Denmark and the U.K., where the variant has been spreading for over a month.
Many epidemiologists believe that the rise in the number of new cases per day could surpass the 250,000 record hit last January. One question still left to answer is whether the omicron variant is as dangerous as previous ones. There is some indication that it typically causes less severe symptoms.
An additional question is whether current vaccinations are effective against the omicron variant. Dr. Tedros Adhanom Ghebreyesus, director general of the World Health Organization, recently pointed out, “Even if omicron does cause less severe disease, the sheer number of cases could once again overwhelm unprepared health systems.”
People have begun to cancel parties, family gatherings, and trips due to anxiety about the new, rapid spread. Several medical organizations have new models that forecast the pace of this spread. The carefully followed Institute for Health Metrics and Evaluation “COVID-19 Projections” model shows that another 200,000 Americans may die from COVID-19 before the end of February.
One other organization that forecasts the spread of COVID-19 is the Mayo Clinic, which publishes a constantly updated U.S. COVID-19 map: What do the trends mean for you? According to Mayo Clinic, the yardstick that best signals hot spots is the rolling average of daily cases for the past week.
The Mayo Clinic tool allows users to look at several data points by state. Among these are average daily cases, cases per 100,000 people, and vaccination rates. Users can choose daily information for the last 60 days and a forecast for the next 14 days.
24/7 Wall St. used the Mayo Clinic tool to forecast cases by state on Christmas Day. The figure projected for that day nationwide is 142,784, or 43.5 cases per 100,000 people. This is for what researchers call the “mid case.” Mayo also provides a low estimate and a high estimate. Nationally, the high case is 150,990, or 46 per 100,000 people, and the low case is 131,295, or 40 per 100,000 people. We used the same forecast basis for each state.
Per capita, New Hampshire is expected to have the highest rate of new COVID-19 cases at 125 per 100,000 residents.
In terms of total number of cases, New York state is expected to have the largest figure at 13,578 daily cases as a rolling seven-day average. The high estimate for New York is 16,340 and the low estimate is 11,477.
One notable fact about New York is that it has not been the leading state in daily new cases since early in the pandemic. It was America’s major hot spot from March to May 2020, but eventually, the largest states by population – California, Texas, and Florida – surpassed it. It appears that, for the time being, New York may take the brunt of the next wave.

20. New Mexico
> Projected case growth on Dec 25: 57 per 100,000 people
> Projected case growth on Dec. 25: 1,193 total new cases — 20th fewest
> High forecast: 71 per 100,000 people (total: 1,488)
> Low forecast: 45 per 100,000 people (total: 943)

19. West Virginia
> Projected case growth on Dec 25: 57 per 100,000 people
> Total COVID-19 cases projected by Christmas: 1,025 total new cases — 17th fewest
> High forecast: 66 per 100,000 people (total: 1,182)
> Low forecast: 49 per 100,000 people (total: 878)

17. Pennsylvania
> Projected case growth on Dec 25: 59 per 100,000 people
> Total COVID-19 cases projected by Christmas: 7,591 total new cases — 4th most
> High forecast: 70 per 100,000 people (total: 8,961)
> Low forecast: 50 per 100,000 people (total: 6,400)

17. Maryland
> Projected case growth on Dec 25: 59 per 100,000 people
> Total COVID-19 cases projected by Christmas: 3,585 total new cases — 17th most
> High forecast: 76 per 100,000 people (total: 4,594)
> Low forecast: 46 per 100,000 people (total: 2,781)

16. Michigan
> Projected case growth on Dec 25: 59 per 100,000 people
> Total COVID-19 cases projected by Christmas: 5,932 total new cases — 7th most
> High forecast: 71 per 100,000 people (total: 7,090)
> Low forecast: 50 per 100,000 people (total: 4,993)

15. New Jersey
> Projected case growth on Dec 25: 60 per 100,000 people
> Total COVID-19 cases projected by Christmas: 5,347 total new cases total new cases — 9th most
> High forecast: 75 per 100,000 people (total: 6,661)
> Low forecast: 47 per 100,000 people (total: 4,174)

14. Kansas
> Projected case growth on Dec 25: 67 per 100,000 people
> Total COVID-19 cases projected by Christmas: 1,949 total new cases — 22nd most
> High forecast: 81 per 100,000 people (total: 2,359)
> Low forecast: 56 per 100,000 people (total: 1,631)
13. Illinois
> Projected case growth on Dec 25: 69 per 100,000 people
> Total COVID-19 cases projected by Christmas: 8,743 total new cases — 3rd most
> High forecast: 85 per 100,000 people (total: 10,771)
> Low forecast: 56 per 100,000 people (total: 7,096)
12. New York
> Projected case growth on Dec 25: 70 per 100,000 people
> Total COVID-19 cases projected by Christmas: 13,578 — the most
> High forecast: 84 per 100,000 people (total: 16,340)
> Low forecast: 59 per 100,000 people (total: 11,477)
11. Minnesota
> Projected case growth on Dec 25: 72 per 100,000 people
> Total COVID-19 cases projected by Christmas: 4,032 total new cases — 12th most
> High forecast: 87 per 100,000 people (total: 4,906)
> Low forecast: 61 per 100,000 people (total: 3,440)

10. Indiana
> Projected case growth on Dec 25: 74 per 100,000 people
> Total COVID-19 cases projected by Christmas: 4,968 total new cases — 10th most
> High forecast: 86 per 100,000 people (total: 5,789)
> Low forecast: 64 per 100,000 people (total: 4,308)

9. Ohio
> Projected case growth on Dec 25: 75 per 100,000 people
> Total COVID-19 cases projected by Christmas: 8,766 total new cases — 2nd most
> High forecast: 92 per 100,000 people (total: 10,753)
> Low forecast: 64 per 100,000 people (total: 7,481)

8. Vermont
> Projected case growth on Dec 25: 78 per 100,000 people
> Total COVID-19 cases projected by Christmas: 484 total new cases — 10th fewest
> High forecast: 97 per 100,000 people (total: 605)
> Low forecast: 61 per 100,000 people (total: 380)

7. Wisconsin
> Projected case growth on Dec 25: 83 per 100,000 people
> Total COVID-19 cases projected by Christmas: 4,820 total new cases — 11th most
> High forecast: 101 per 100,000 people (total: 5,880)
> Low forecast: 72 per 100,000 people (total: 4,192)

6. Delaware
> Projected case growth on Dec 25: 84 per 100,000 people
> Total COVID-19 cases projected by Christmas: 815 total new cases — 14th fewest
> High forecast: 113 per 100,000 people (total: 1,100)
> Low forecast: 64 per 100,000 people (total: 623)

5. Massachusetts
> Projected case growth on Dec 25: 93 per 100,000 people
> Total COVID-19 cases projected by Christmas: 6,430 total new cases — 6th most
> High forecast: 134 per 100,000 people (total: 9,235)
> Low forecast: 75 per 100,000 people (total: 5,169)
4. Maine
> Projected case growth on Dec 25: 95 per 100,000 people
> Total COVID-19 cases projected by Christmas: 1,279 total new cases — 21st fewest
> High forecast: 124 per 100,000 people (total: 1,666)
> Low forecast: 73 per 100,000 people (total: 981)

3. Connecticut
> Projected case growth on Dec 25: 113 per 100,000 people
> Total COVID-19 cases projected by Christmas: 4,021 total new cases — 13th most
> High forecast: 155 per 100,000 people (total: 5,526)
> Low forecast: 78 per 100,000 people (total: 2,780)

2. Rhode Island
> Projected case growth on Dec 25: 153 per 100,000 people
> Total COVID-19 cases projected by Christmas: 1,618 total new cases — 25th fewest
> High forecast: 235 per 100,000 people (total: 2,489)
> Low forecast: 110 per 100,000 people (total: 1,165)

1. New Hampshire
> Projected case growth on Dec 25: 155 per 100,000 people
> Total COVID-19 cases projected by Christmas: 2,111 total new cases — 21st most
> High forecast: 222 per 100,000 people (total: 3,018)
> Low forecast: 125 per 100,000 people (total: 1,699)