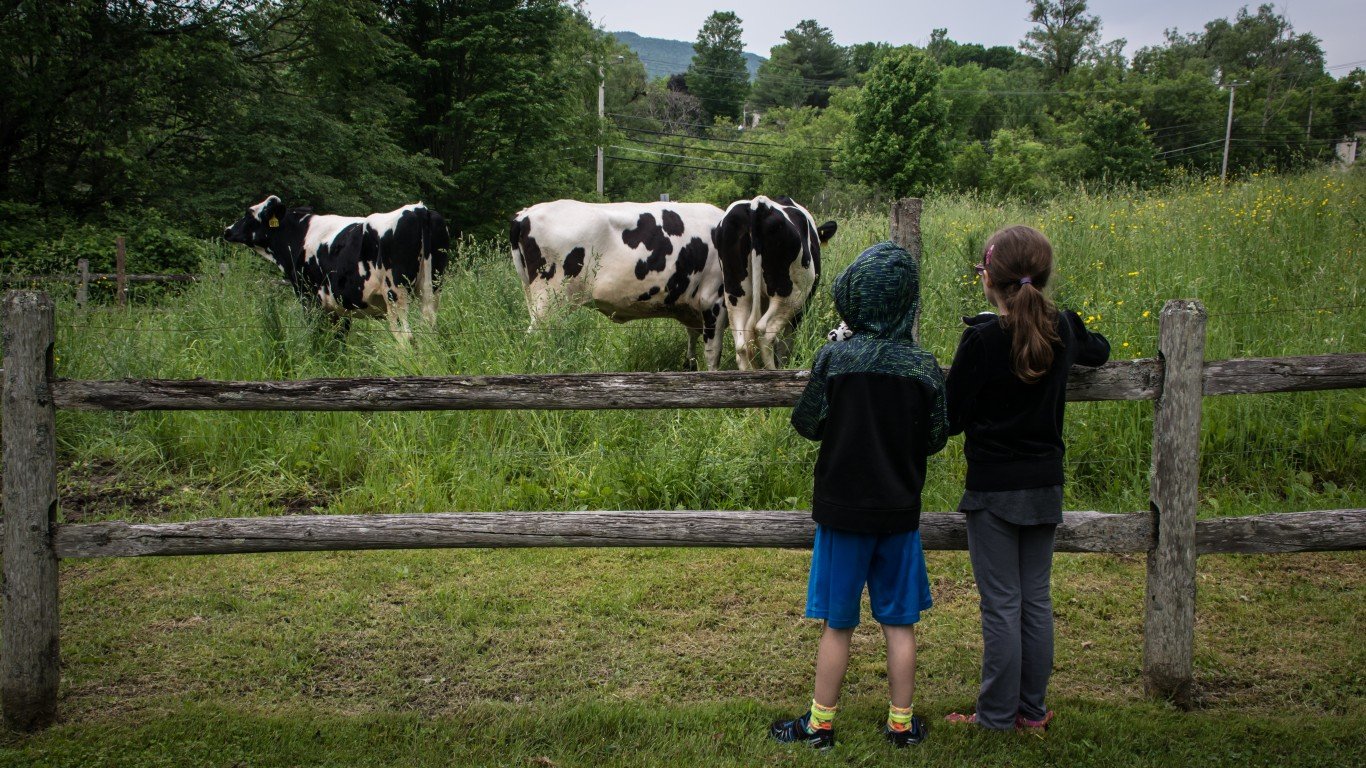
The percentage of children and adolescents who are not just overweight but obese has more than tripled since the 1970s, according to the Centers for Disease Control and Prevention. By 2018, nearly one in five children between the age of 2 and 19 are obese.
Obesity is defined as a BMI at or above the 95th percentile for children and teens of the same age and sex. Obesity can increase the risk of a number of serious diseases and conditions, including heart disease, type 2 diabetes, and certain types of cancer.
To determine the states struggling where children in high school — ninth to 12th graders — are struggling obesity, 24/7 Tempo reviewed 2019 data from the Youth Risk Behavior Surveillance System. We ranked the states based on the reported youth obesity rate as of 2019, the latest year for which data is available. Eight states — Delaware, Indiana, Massachusetts, Minnesota, Ohio, Oregon, Washington, Wyoming — do not have data on youth obesity from the YRBSS.
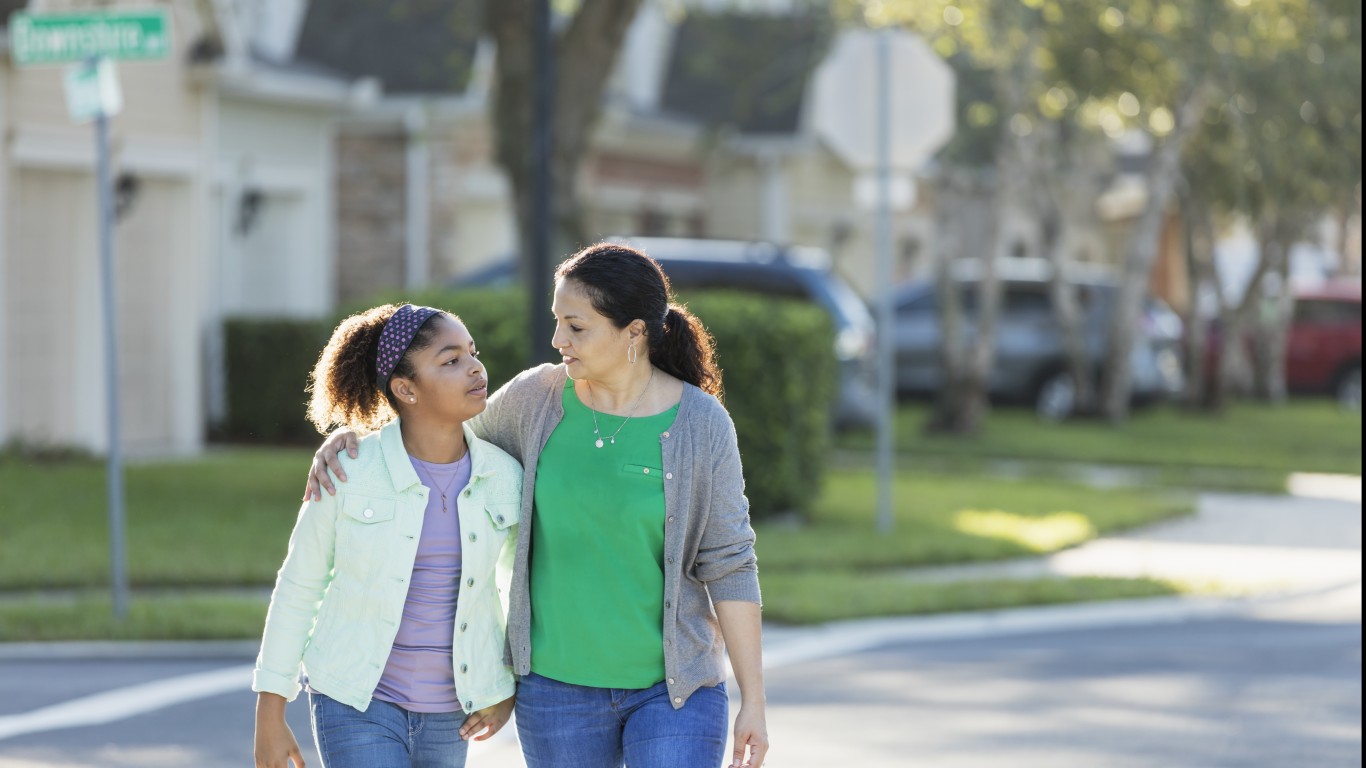
Genetic background, environmental factors, and lifestyle preferences, are just some of the factors that contribute to obesity and its concentration in certain parts of the country.
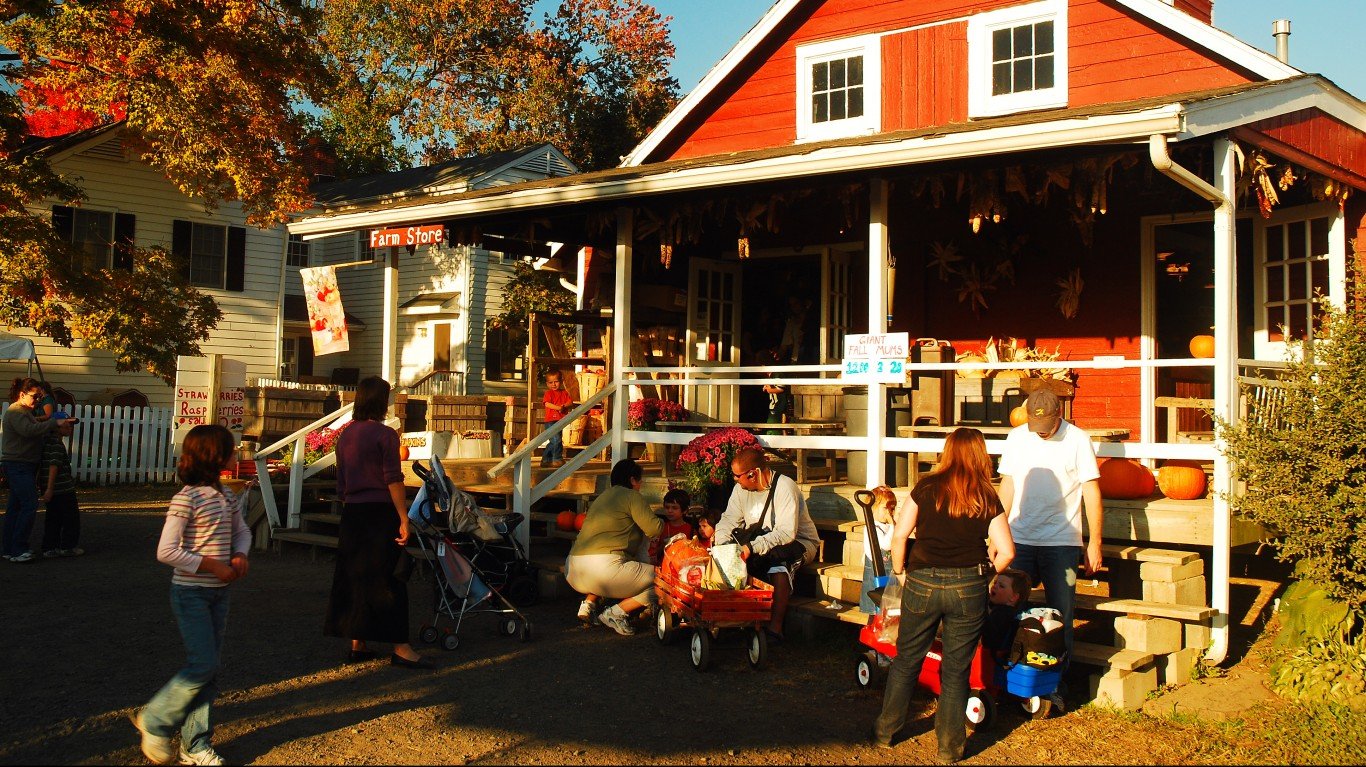
Poverty is another potential factor contributing to a higher obesity rate among children. Healthier foods that tend to be lower in calories and more nutritious are relatively more expensive and may be less affordable to low-income households. States that are struggling the most with childhood obesity tend to have a relatively high share of children living in poverty.
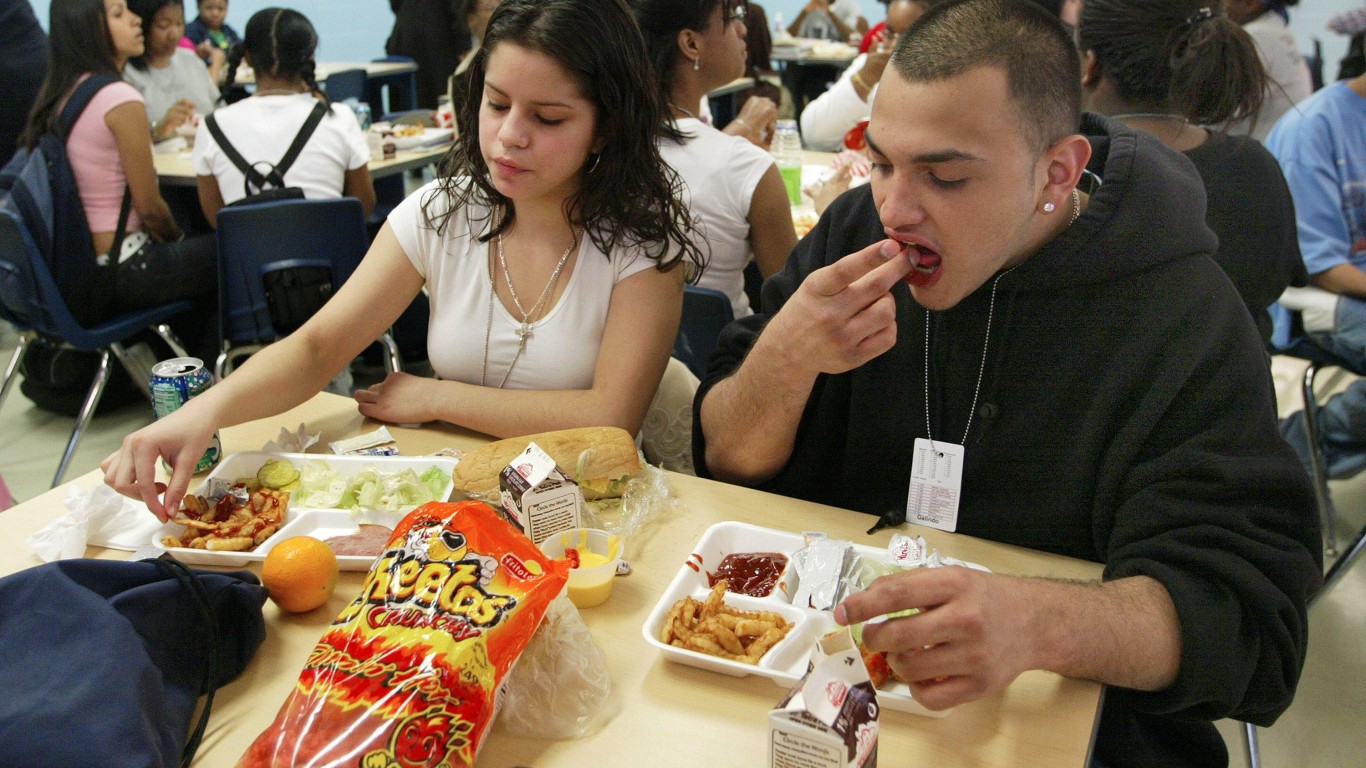
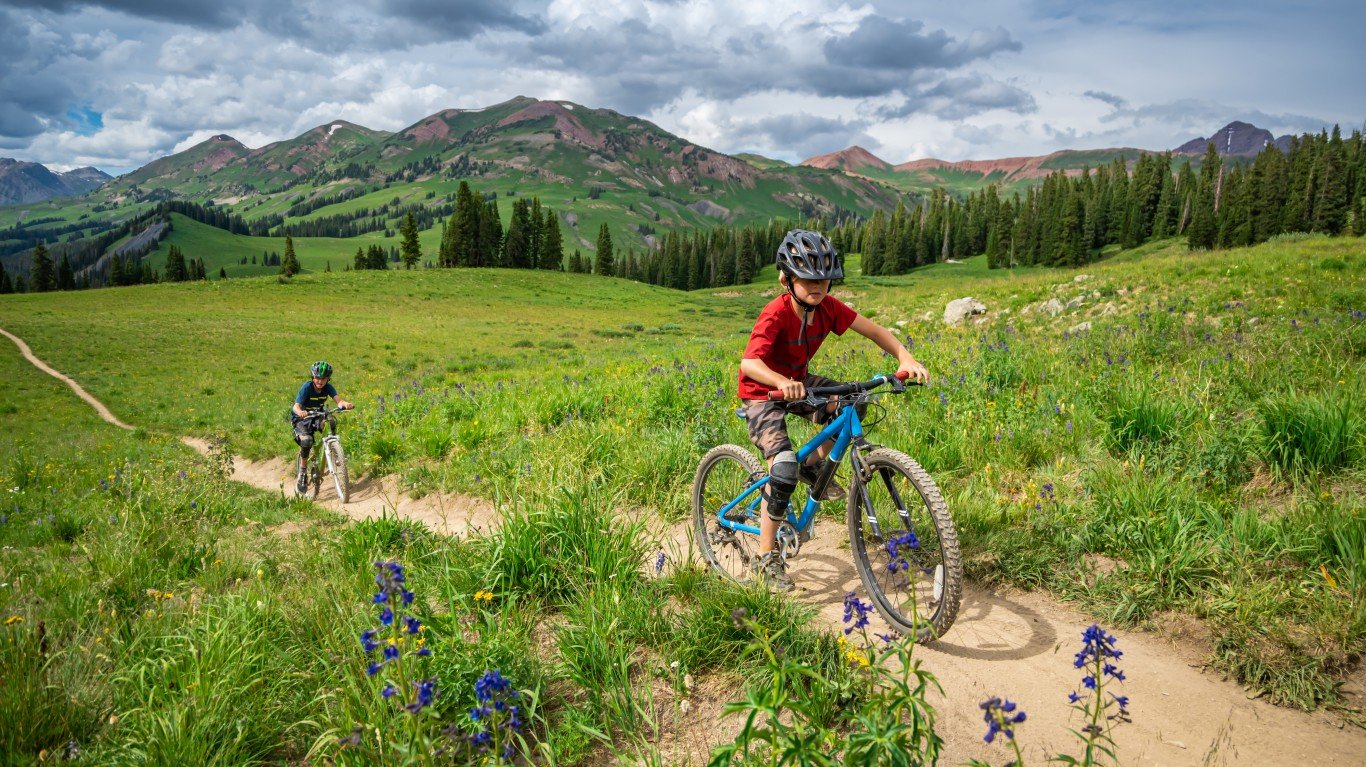
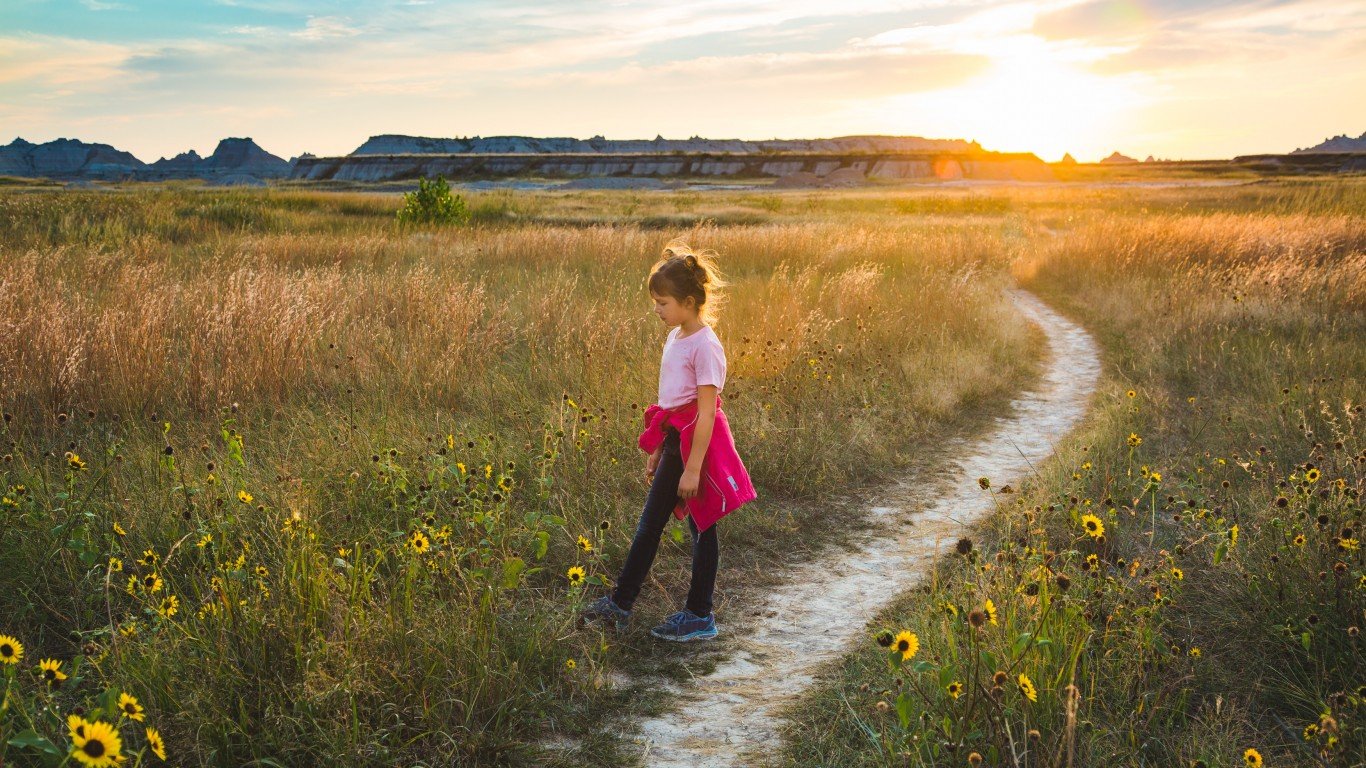
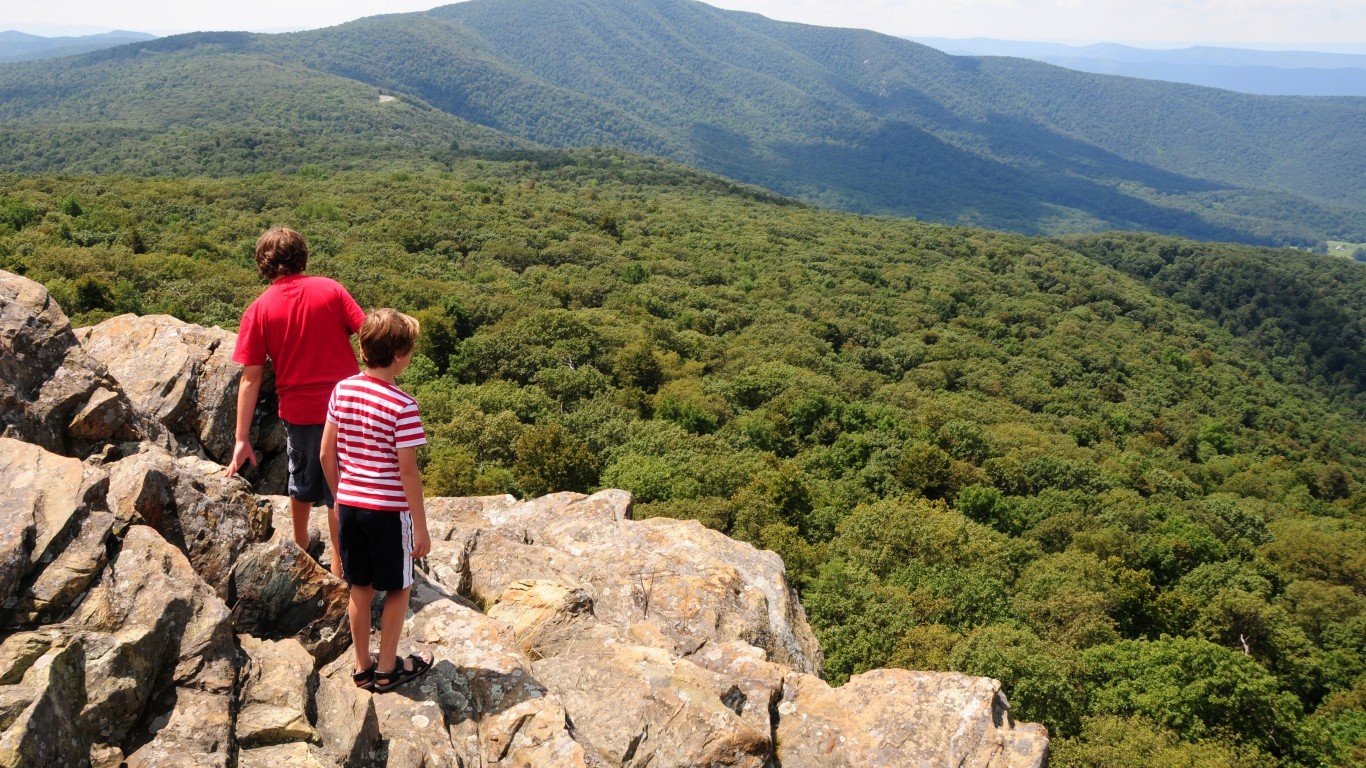
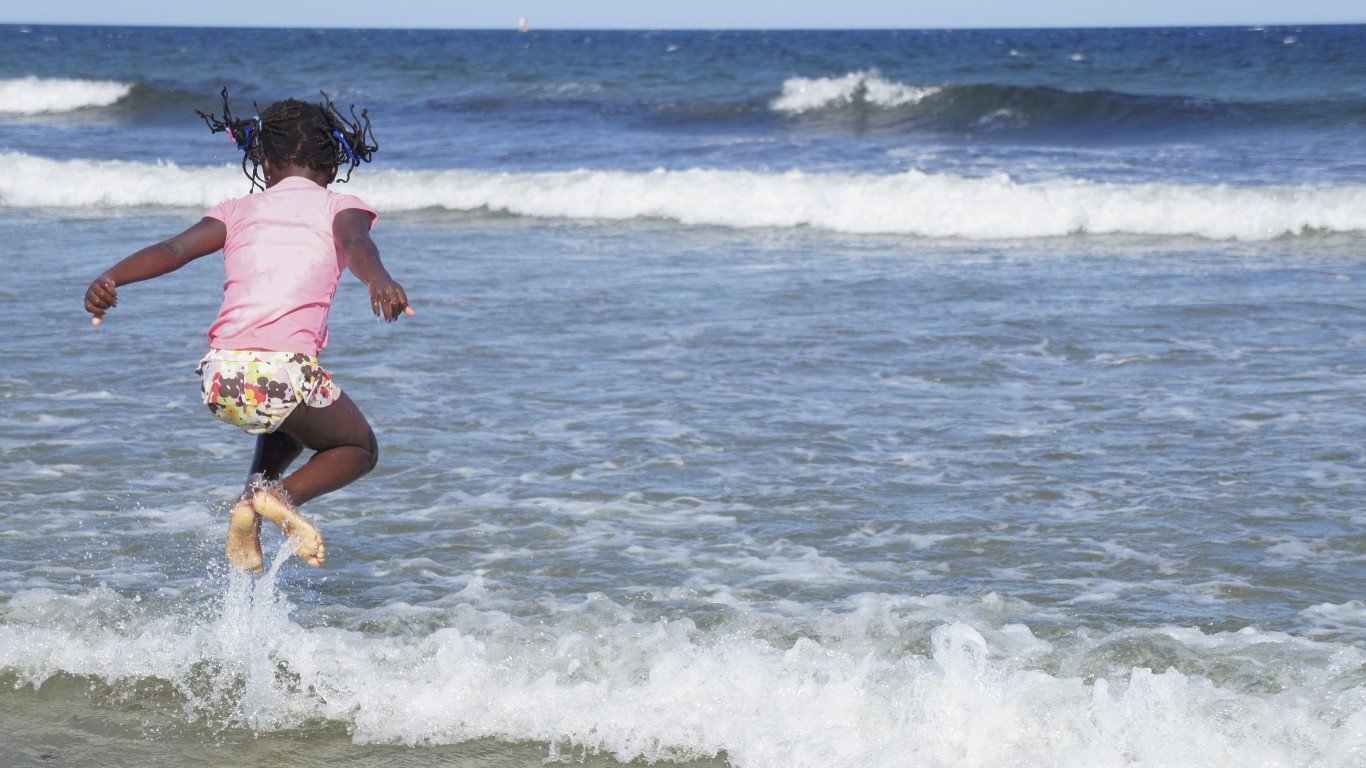
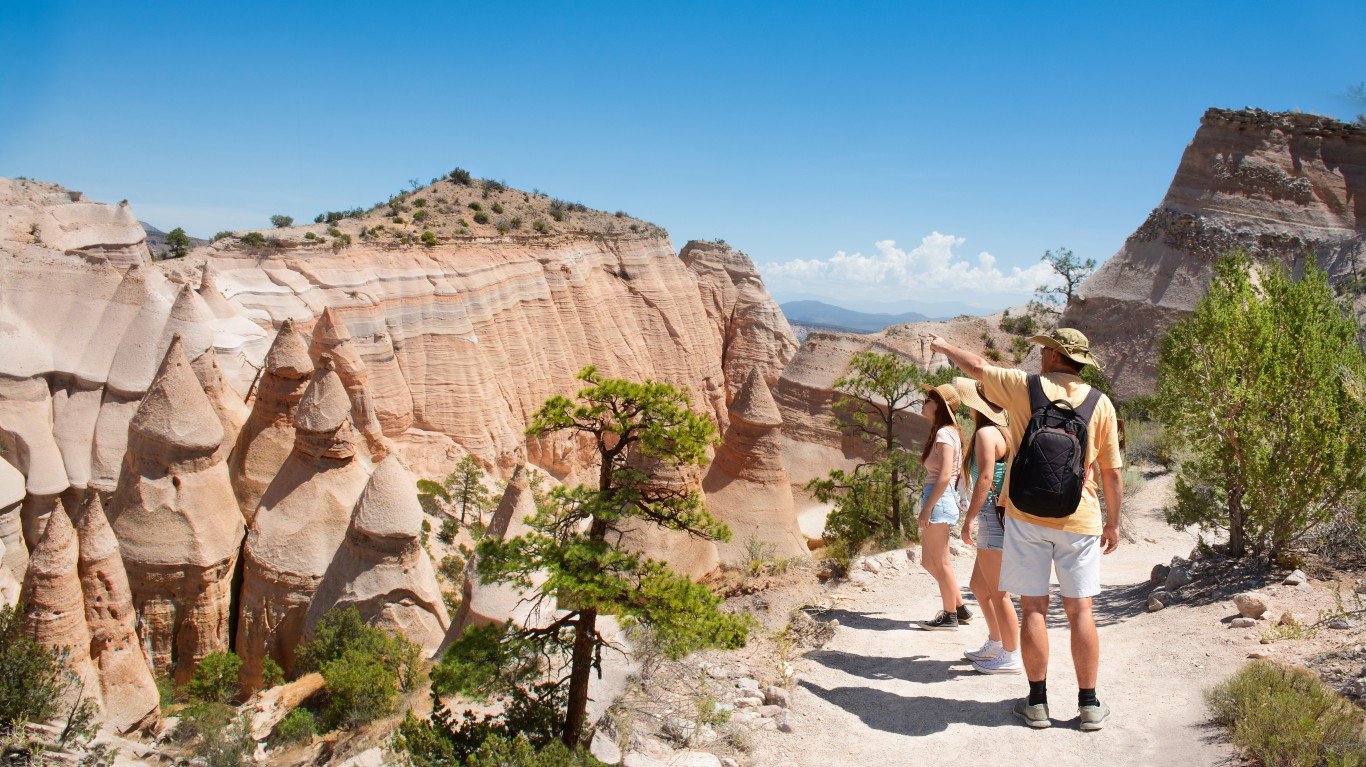
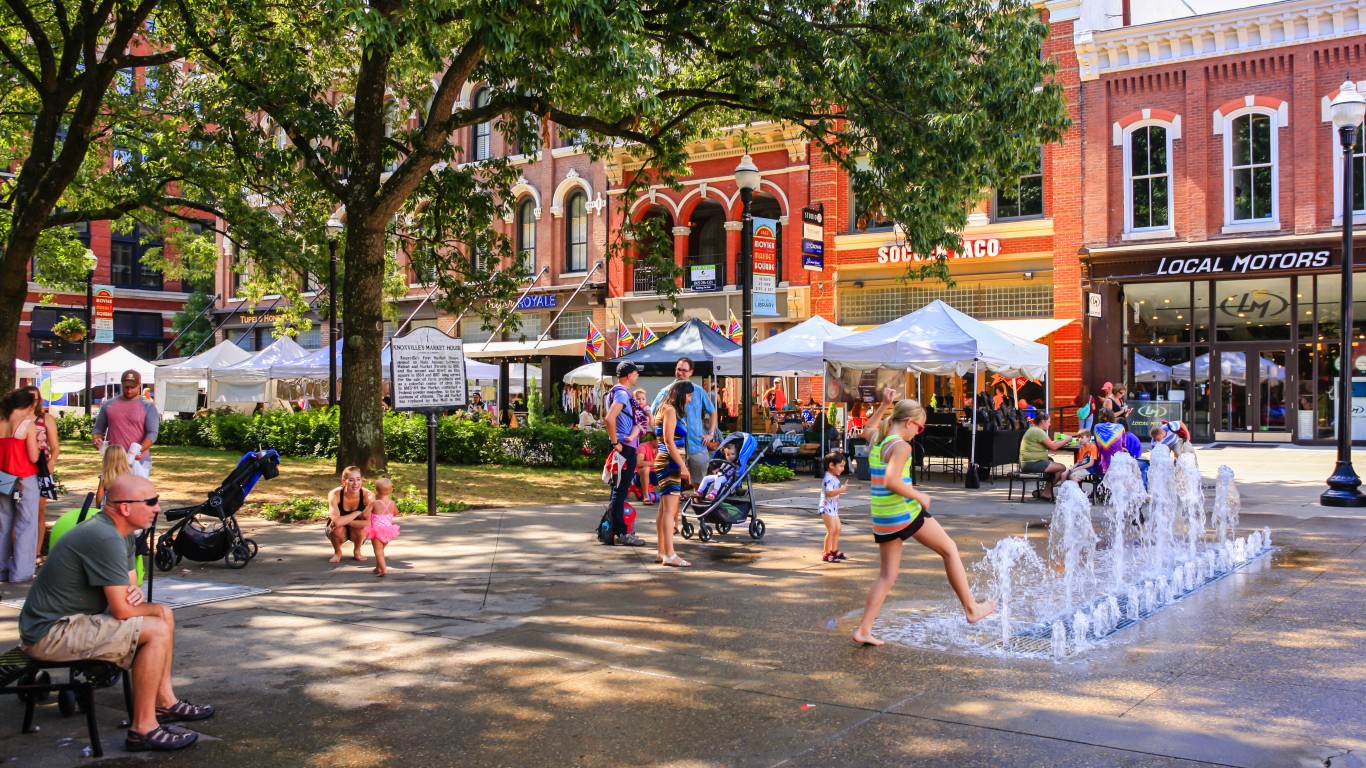
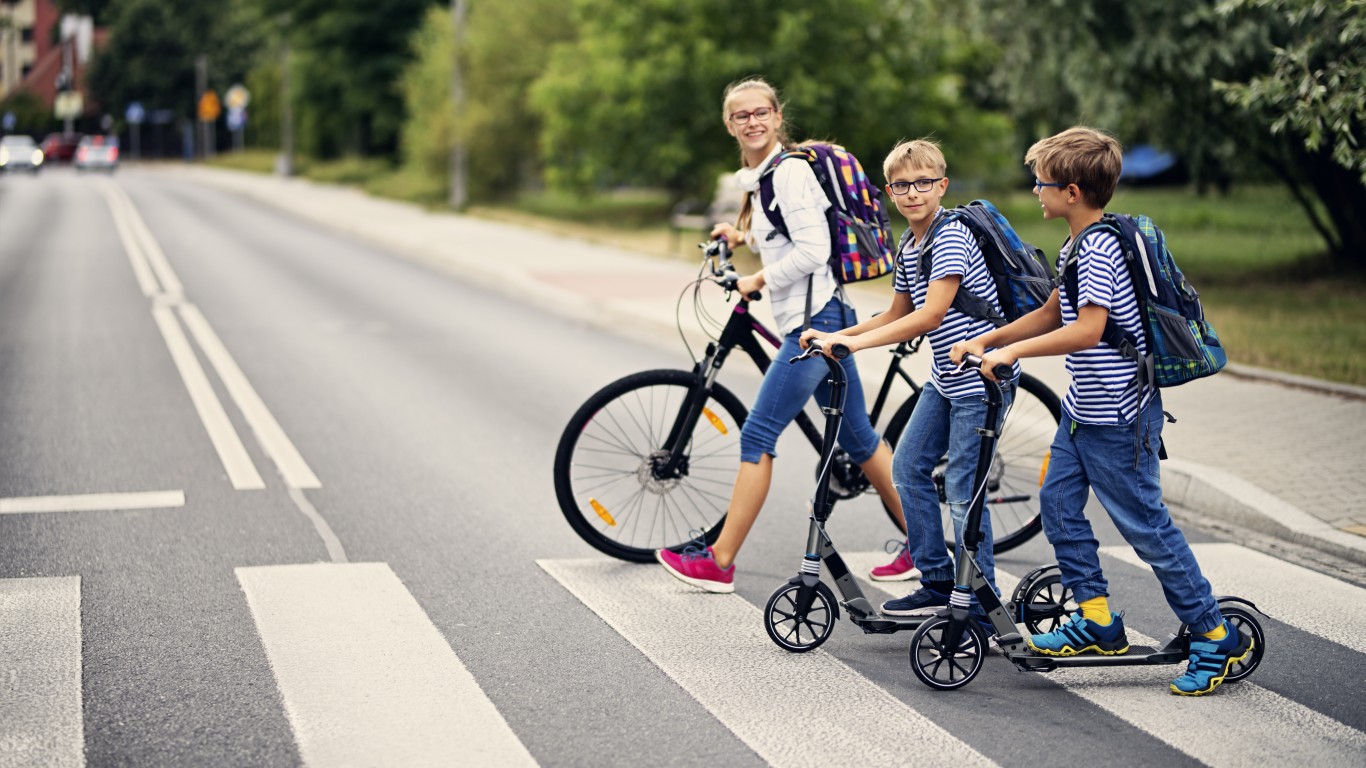
Health experts have pointed to several lifestyle factors that are likely contributing to the excess weight problem among Americans, among them a sedentary lifestyle and the consumption of high-calorie diets, including large sugary beverages — these are the unhealthiest items in the most popular fast-food chains in America.

42. Utah
> Youth (9th-12th grade) obesity rate: 9.8%
> Share of youths who are overweight: 12.3% — 10th lowest
> Physically active youths, 5+ days a week: 47.4% — 14th highest
> Communities built to promote physical activity: 92.0% — the highest
> Children (2-19) with easy access to parks and playgrounds: 89.7% — the highest
> Child poverty rate: 9.9% — 2nd lowest
> Overall poverty rate: 8.9% — 2nd lowest
> Median household income: $75,780 a year — 11th highest
> Population under 18: 29.0% — the highest (total under 18 pop: 930,308)
41. Colorado
> Youth (9th-12th grade) obesity rate: 10.3%
> Share of youths who are overweight: 11.7% — 9th lowest
> Physically active youths, 5+ days a week: 49.8% — 8th highest
> Communities built to promote physical activity: 89.5% — 3rd highest
> Children (2-19) with easy access to parks and playgrounds: 87.9% — 5th highest
> Child poverty rate: 10.9% — 5th lowest
> Overall poverty rate: 9.3% — 7th lowest
> Median household income: $77,127 a year — 9th highest
> Population under 18: 21.8% — 19th lowest (total under 18 pop: 1,256,320)
40. Montana
> Youth (9th-12th grade) obesity rate: 11.5%
> Share of youths who are overweight: 13.0% — 13th lowest
> Physically active youths, 5+ days a week: 53.4% — the highest
> Communities built to promote physical activity: 69.6% — 20th lowest
> Children (2-19) with easy access to parks and playgrounds: 73.3% — 23rd lowest
> Child poverty rate: 14.9% — 24th lowest
> Overall poverty rate: 12.6% — 20th highest
> Median household income: $57,153 a year — 11th lowest
> Population under 18: 21.2% — 13th lowest (total under 18 pop: 226,524)
39. New Jersey
> Youth (9th-12th grade) obesity rate: 11.9%
> Share of youths who are overweight: 14.7% — 20th lowest
> Physically active youths, 5+ days a week: N/A
> Communities built to promote physical activity: 83.3% — 9th highest
> Children (2-19) with easy access to parks and playgrounds: 88.9% — 3rd highest
> Child poverty rate: 12.3% — 12th lowest
> Overall poverty rate: 9.2% — 5th lowest
> Median household income: $85,751 a year — 3rd highest
> Population under 18: 21.8% — 20th lowest (total under 18 pop: 1,938,024)
38. Idaho
> Youth (9th-12th grade) obesity rate: 12.1%
> Share of youths who are overweight: 12.4% — 11th lowest
> Physically active youths, 5+ days a week: 50.4% — 7th highest
> Communities built to promote physical activity: 74.0% — 24th highest
> Children (2-19) with easy access to parks and playgrounds: 72.8% — 19th lowest
> Child poverty rate: 13.2% — 17th lowest
> Overall poverty rate: 11.2% — 21st lowest
> Median household income: $60,999 a year — 20th lowest
> Population under 18: 25.1% — 3rd highest (total under 18 pop: 449,355)
37. Nevada
> Youth (9th-12th grade) obesity rate: 12.3%
> Share of youths who are overweight: 16.7% — 11th highest
> Physically active youths, 5+ days a week: 46.4% — 16th highest
> Communities built to promote physical activity: 88.2% — 4th highest
> Children (2-19) with easy access to parks and playgrounds: 80.1% — 18th highest
> Child poverty rate: 16.9% — 20th highest
> Overall poverty rate: 12.5% — 21st highest
> Median household income: $63,276 a year — 24th highest
> Population under 18: 22.4% — 21st highest (total under 18 pop: 690,737)
36. New Hampshire
> Youth (9th-12th grade) obesity rate: 12.7%
> Share of youths who are overweight: 14.0% — 15th lowest
> Physically active youths, 5+ days a week: 47.2% — 15th highest
> Communities built to promote physical activity: 58.7% — 11th lowest
> Children (2-19) with easy access to parks and playgrounds: 69.2% — 13th lowest
> Child poverty rate: 7.1% — the lowest
> Overall poverty rate: 7.3% — the lowest
> Median household income: $77,933 a year — 8th highest
> Population under 18: 18.8% — 3rd lowest (total under 18 pop: 256,020)
35. Maryland
> Youth (9th-12th grade) obesity rate: 12.8%
> Share of youths who are overweight: 15.7% — 23rd highest
> Physically active youths, 5+ days a week: 35.2% — 13th lowest
> Communities built to promote physical activity: 80.8% — 13th highest
> Children (2-19) with easy access to parks and playgrounds: 82.7% — 11th highest
> Child poverty rate: 12.0% — 11th lowest
> Overall poverty rate: 9.0% — 4th lowest
> Median household income: $86,738 a year — the highest
> Population under 18: 22.0% — 24th lowest (total under 18 pop: 1,332,287)
34. Vermont
> Youth (9th-12th grade) obesity rate: 13.1%
> Share of youths who are overweight: 13.7% — 14th lowest
> Physically active youths, 5+ days a week: 49.1% — 11th highest
> Communities built to promote physical activity: 65.3% — 14th lowest
> Children (2-19) with easy access to parks and playgrounds: 73.0% — 21st lowest
> Child poverty rate: 10.2% — 4th lowest
> Overall poverty rate: 10.2% — 15th lowest
> Median household income: $63,001 a year — 25th lowest
> Population under 18: 18.2% — the lowest (total under 18 pop: 113,559)

33. Nebraska
> Youth (9th-12th grade) obesity rate: 13.3%
> Share of youths who are overweight: 12.8% — 12th lowest
> Physically active youths, 5+ days a week: 51.7% — 3rd highest
> Communities built to promote physical activity: 86.8% — 6th highest
> Children (2-19) with easy access to parks and playgrounds: 84.5% — 9th highest
> Child poverty rate: 11.0% — 6th lowest
> Overall poverty rate: 9.9% — 10th lowest
> Median household income: $63,229 a year — 25th highest
> Population under 18: 24.6% — 5th highest (total under 18 pop: 475,096)
32. Arizona
> Youth (9th-12th grade) obesity rate: 13.3%
> Share of youths who are overweight: 17.4% — 10th highest
> Physically active youths, 5+ days a week: 46.3% — 17th highest
> Communities built to promote physical activity: 86.2% — 7th highest
> Children (2-19) with easy access to parks and playgrounds: 81.9% — 13th highest
> Child poverty rate: 19.1% — 13th highest
> Overall poverty rate: 13.5% — 13th highest
> Median household income: $62,055 a year — 23rd lowest
> Population under 18: 22.5% — 19th highest (total under 18 pop: 1,639,648)

31. New York
> Youth (9th-12th grade) obesity rate: 13.4%
> Share of youths who are overweight: 16.3% — 14th highest
> Physically active youths, 5+ days a week: 42.4% — 25th lowest
> Communities built to promote physical activity: 81.8% — 11th highest
> Children (2-19) with easy access to parks and playgrounds: 88.6% — 4th highest
> Child poverty rate: 18.1% — 16th highest
> Overall poverty rate: 13.0% — 16th highest
> Median household income: $72,108 a year — 14th highest
> Population under 18: 20.7% — 11th lowest (total under 18 pop: 4,022,096)
30. Florida
> Youth (9th-12th grade) obesity rate: 14.0%
> Share of youths who are overweight: 16.1% — 16th highest
> Physically active youths, 5+ days a week: 39.3% — 17th lowest
> Communities built to promote physical activity: 80.1% — 14th highest
> Children (2-19) with easy access to parks and playgrounds: 73.4% — 24th lowest
> Child poverty rate: 17.7% — 17th highest
> Overall poverty rate: 12.7% — 19th highest
> Median household income: $59,227 a year — 17th lowest
> Population under 18: 19.7% — 6th lowest (total under 18 pop: 4,231,955)
29. North Dakota
> Youth (9th-12th grade) obesity rate: 14.0%
> Share of youths who are overweight: 16.5% — 13th highest
> Physically active youths, 5+ days a week: 51.5% — 5th highest
> Communities built to promote physical activity: 80.9% — 12th highest
> Children (2-19) with easy access to parks and playgrounds: 81.8% — 14th highest
> Child poverty rate: 10.2% — 4th lowest
> Overall poverty rate: 10.6% — 17th lowest
> Median household income: $64,577 a year — 20th highest
> Population under 18: 23.2% — 13th highest (total under 18 pop: 176,706)
28. South Dakota
> Youth (9th-12th grade) obesity rate: 14.1%
> Share of youths who are overweight: 15.6% — 25th highest
> Physically active youths, 5+ days a week: N/A
> Communities built to promote physical activity: 79.1% — 18th highest
> Children (2-19) with easy access to parks and playgrounds: 79.8% — 19th highest
> Child poverty rate: 15.0% — 25th lowest
> Overall poverty rate: 11.9% — 23rd highest
> Median household income: $59,533 a year — 18th lowest
> Population under 18: 24.3% — 6th highest (total under 18 pop: 215,269)

27. Rhode Island
> Youth (9th-12th grade) obesity rate: 14.3%
> Share of youths who are overweight: 14.6% — 18th lowest
> Physically active youths, 5+ days a week: 41.3% — 19th lowest
> Communities built to promote physical activity: 74.3% — 23rd highest
> Children (2-19) with easy access to parks and playgrounds: 83.9% — 10th highest
> Child poverty rate: 14.0% — 21st lowest
> Overall poverty rate: 10.8% — 18th lowest
> Median household income: $71,169 a year — 15th highest
> Population under 18: 19.2% — 4th lowest (total under 18 pop: 203,575)
26. Connecticut
> Youth (9th-12th grade) obesity rate: 14.4%
> Share of youths who are overweight: 14.9% — 22nd lowest
> Physically active youths, 5+ days a week: 44.0% — 23rd highest
> Communities built to promote physical activity: 68.8% — 18th lowest
> Children (2-19) with easy access to parks and playgrounds: 76.2% — 25th highest
> Child poverty rate: 14.1% — 22nd lowest
> Overall poverty rate: 10.0% — 12th lowest
> Median household income: $78,833 a year — 6th highest
> Population under 18: 20.4% — 8th lowest (total under 18 pop: 727,432)

25. Wisconsin
> Youth (9th-12th grade) obesity rate: 14.5%
> Share of youths who are overweight: 14.6% — 19th lowest
> Physically active youths, 5+ days a week: 48.7% — 12th highest
> Communities built to promote physical activity: 70.3% — 21st lowest
> Children (2-19) with easy access to parks and playgrounds: 78.9% — 20th highest
> Child poverty rate: 13.5% — 19th lowest
> Overall poverty rate: 10.4% — 16th lowest
> Median household income: $64,168 a year — 21st highest
> Population under 18: 21.7% — 17th lowest (total under 18 pop: 1,263,412)

24. Alaska
> Youth (9th-12th grade) obesity rate: 14.8%
> Share of youths who are overweight: 15.0% — 23rd lowest
> Physically active youths, 5+ days a week: 41.4% — 20th lowest
> Communities built to promote physical activity: 68.8% — 18th lowest
> Children (2-19) with easy access to parks and playgrounds: 73.0% — 21st lowest
> Child poverty rate: 13.0% — 15th lowest
> Overall poverty rate: 10.1% — 13th lowest
> Median household income: $75,463 a year — 12th highest
> Population under 18: 24.6% — 4th highest (total under 18 pop: 179,749)
23. Virginia
> Youth (9th-12th grade) obesity rate: 14.8%
> Share of youths who are overweight: 15.8% — 21st highest
> Physically active youths, 5+ days a week: 42.3% — 23rd lowest
> Communities built to promote physical activity: 65.5% — 15th lowest
> Children (2-19) with easy access to parks and playgrounds: 69.8% — 14th lowest
> Child poverty rate: 13.4% — 18th lowest
> Overall poverty rate: 9.9% — 11th lowest
> Median household income: $76,456 a year — 10th highest
> Population under 18: 21.8% — 18th lowest (total under 18 pop: 1,857,605)
22. Maine
> Youth (9th-12th grade) obesity rate: 14.9%
> Share of youths who are overweight: 14.8% — 21st lowest
> Physically active youths, 5+ days a week: 42.2% — 21st lowest
> Communities built to promote physical activity: 58.9% — 12th lowest
> Children (2-19) with easy access to parks and playgrounds: 70.2% — 15th lowest
> Child poverty rate: 13.8% — 20th lowest
> Overall poverty rate: 10.9% — 19th lowest
> Median household income: $58,924 a year — 16th lowest
> Population under 18: 18.3% — 2nd lowest (total under 18 pop: 246,353)

21. Kansas
> Youth (9th-12th grade) obesity rate: 15.1%
> Share of youths who are overweight: 15.7% — 24th highest
> Physically active youths, 5+ days a week: 52.6% — 2nd highest
> Communities built to promote physical activity: 73.0% — 25th highest
> Children (2-19) with easy access to parks and playgrounds: 77.3% — 22nd highest
> Child poverty rate: 14.7% — 23rd lowest
> Overall poverty rate: 11.4% — 24th lowest
> Median household income: $62,087 a year — 24th lowest
> Population under 18: 24.0% — 8th highest (total under 18 pop: 700,301)

20. Illinois
> Youth (9th-12th grade) obesity rate: 15.2%
> Share of youths who are overweight: 15.5% — 25th lowest
> Physically active youths, 5+ days a week: 49.3% — 9th highest
> Communities built to promote physical activity: 87.9% — 5th highest
> Children (2-19) with easy access to parks and playgrounds: 89.2% — 2nd highest
> Child poverty rate: 15.7% — 23rd highest
> Overall poverty rate: 11.5% — 25th lowest
> Median household income: $69,187 a year — 17th highest
> Population under 18: 22.2% — 24th highest (total under 18 pop: 2,814,679)
19. New Mexico
> Youth (9th-12th grade) obesity rate: 15.2%
> Share of youths who are overweight: 15.8% — 22nd highest
> Physically active youths, 5+ days a week: 51.2% — 6th highest
> Communities built to promote physical activity: 75.3% — 22nd highest
> Children (2-19) with easy access to parks and playgrounds: 70.9% — 16th lowest
> Child poverty rate: 24.9% — 3rd highest
> Overall poverty rate: 18.2% — 3rd highest
> Median household income: $51,945 a year — 6th lowest
> Population under 18: 22.6% — 18th highest (total under 18 pop: 473,850)

18. Michigan
> Youth (9th-12th grade) obesity rate: 15.3%
> Share of youths who are overweight: 16.1% — 17th highest
> Physically active youths, 5+ days a week: 45.6% — 20th highest
> Communities built to promote physical activity: 72.5% — 24th lowest
> Children (2-19) with easy access to parks and playgrounds: 76.6% — 24th highest
> Child poverty rate: 17.6% — 18th highest
> Overall poverty rate: 13.0% — 17th highest
> Median household income: $59,584 a year — 19th lowest
> Population under 18: 21.5% — 15th lowest (total under 18 pop: 2,142,822)
17. Pennsylvania
> Youth (9th-12th grade) obesity rate: 15.4%
> Share of youths who are overweight: 14.5% — 17th lowest
> Physically active youths, 5+ days a week: 42.4% — 25th lowest
> Communities built to promote physical activity: 72.7% — 25th lowest
> Children (2-19) with easy access to parks and playgrounds: 81.8% — 14th highest
> Child poverty rate: 16.9% — 20th highest
> Overall poverty rate: 12.0% — 22nd highest
> Median household income: $63,463 a year — 23rd highest
> Population under 18: 20.6% — 10th lowest (total under 18 pop: 2,632,325)
16. North Carolina
> Youth (9th-12th grade) obesity rate: 15.4%
> Share of youths who are overweight: 16.0% — 19th highest
> Physically active youths, 5+ days a week: 42.3% — 23rd lowest
> Communities built to promote physical activity: 55.2% — 8th lowest
> Children (2-19) with easy access to parks and playgrounds: 56.7% — 6th lowest
> Child poverty rate: 19.5% — 11th highest
> Overall poverty rate: 13.6% — 12th highest
> Median household income: $57,341 a year — 12th lowest
> Population under 18: 21.9% — 22nd lowest (total under 18 pop: 2,293,972)

15. California
> Youth (9th-12th grade) obesity rate: 15.9%
> Share of youths who are overweight: 15.2% — 24th lowest
> Physically active youths, 5+ days a week: 51.7% — 3rd highest
> Communities built to promote physical activity: 89.9% — 2nd highest
> Children (2-19) with easy access to parks and playgrounds: 87.5% — 6th highest
> Child poverty rate: 15.6% — 24th highest
> Overall poverty rate: 11.8% — 25th highest
> Median household income: $80,440 a year — 5th highest
> Population under 18: 22.5% — 20th highest (total under 18 pop: 8,891,064)

14. Hawaii
> Youth (9th-12th grade) obesity rate: 16.4%
> Share of youths who are overweight: 14.4% — 16th lowest
> Physically active youths, 5+ days a week: 36.6% — 15th lowest
> Communities built to promote physical activity: 80.1% — 14th highest
> Children (2-19) with easy access to parks and playgrounds: 87.2% — 7th highest
> Child poverty rate: 12.4% — 13th lowest
> Overall poverty rate: 9.3% — 6th lowest
> Median household income: $83,102 a year — 4th highest
> Population under 18: 21.2% — 14th lowest (total under 18 pop: 300,187)

13. Louisiana
> Youth (9th-12th grade) obesity rate: 16.5%
> Share of youths who are overweight: 17.8% — 7th highest
> Physically active youths, 5+ days a week: 35.3% — 14th lowest
> Communities built to promote physical activity: 56.5% — 9th lowest
> Children (2-19) with easy access to parks and playgrounds: 59.0% — 9th lowest
> Child poverty rate: 27.0% — 2nd highest
> Overall poverty rate: 19.0% — 2nd highest
> Median household income: $51,073 a year — 4th lowest
> Population under 18: 23.3% — 11th highest (total under 18 pop: 1,084,886)

12. South Carolina
> Youth (9th-12th grade) obesity rate: 16.6%
> Share of youths who are overweight: 16.3% — 15th highest
> Physically active youths, 5+ days a week: 36.8% — 16th lowest
> Communities built to promote physical activity: 52.2% — 6th lowest
> Children (2-19) with easy access to parks and playgrounds: 56.3% — 4th lowest
> Child poverty rate: 19.7% — 9th highest
> Overall poverty rate: 13.8% — 10th highest
> Median household income: $56,227 a year — 10th lowest
> Population under 18: 21.6% — 16th lowest (total under 18 pop: 1,112,300)

11. Texas
> Youth (9th-12th grade) obesity rate: 16.9%
> Share of youths who are overweight: 17.8% — 8th highest
> Physically active youths, 5+ days a week: 42.9% — 25th highest
> Communities built to promote physical activity: 78.0% — 19th highest
> Children (2-19) with easy access to parks and playgrounds: 74.2% — 25th lowest
> Child poverty rate: 19.2% — 12th highest
> Overall poverty rate: 13.6% — 11th highest
> Median household income: $64,034 a year — 22nd highest
> Population under 18: 25.5% — 2nd highest (total under 18 pop: 7,396,631)

10. Iowa
> Youth (9th-12th grade) obesity rate: 17.0%
> Share of youths who are overweight: 15.9% — 20th highest
> Physically active youths, 5+ days a week: 49.2% — 10th highest
> Communities built to promote physical activity: 77.8% — 20th highest
> Children (2-19) with easy access to parks and playgrounds: 77.1% — 23rd highest
> Child poverty rate: 13.0% — 15th lowest
> Overall poverty rate: 11.2% — 20th lowest
> Median household income: $61,691 a year — 21st lowest
> Population under 18: 22.9% — 17th highest (total under 18 pop: 721,830)

9. Alabama
> Youth (9th-12th grade) obesity rate: 17.2%
> Share of youths who are overweight: 20.1% — the highest
> Physically active youths, 5+ days a week: N/A
> Communities built to promote physical activity: 48.3% — 4th lowest
> Children (2-19) with easy access to parks and playgrounds: 53.1% — 2nd lowest
> Child poverty rate: 21.4% — 6th highest
> Overall poverty rate: 15.5% — 7th highest
> Median household income: $51,734 a year — 5th lowest
> Population under 18: 22.1% — 25th highest (total under 18 pop: 1,085,597)

8. Oklahoma
> Youth (9th-12th grade) obesity rate: 17.6%
> Share of youths who are overweight: 18.1% — 4th highest
> Physically active youths, 5+ days a week: 48.1% — 13th highest
> Communities built to promote physical activity: 47.9% — 3rd lowest
> Children (2-19) with easy access to parks and playgrounds: 64.4% — 10th lowest
> Child poverty rate: 19.9% — 8th highest
> Overall poverty rate: 15.2% — 8th highest
> Median household income: $54,449 a year — 8th lowest
> Population under 18: 24.1% — 7th highest (total under 18 pop: 952,229)

7. Georgia
> Youth (9th-12th grade) obesity rate: 18.3%
> Share of youths who are overweight: 18.1% — 5th highest
> Physically active youths, 5+ days a week: N/A
> Communities built to promote physical activity: 57.7% — 10th lowest
> Children (2-19) with easy access to parks and playgrounds: 68.0% — 12th lowest
> Child poverty rate: 18.7% — 14th highest
> Overall poverty rate: 13.3% — 14th highest
> Median household income: $61,980 a year — 22nd lowest
> Population under 18: 23.6% — 9th highest (total under 18 pop: 2,503,029)
6. Kentucky
> Youth (9th-12th grade) obesity rate: 18.4%
> Share of youths who are overweight: 17.8% — 9th highest
> Physically active youths, 5+ days a week: 40.6% — 18th lowest
> Communities built to promote physical activity: 61.2% — 13th lowest
> Children (2-19) with easy access to parks and playgrounds: 58.8% — 8th lowest
> Child poverty rate: 21.7% — 5th highest
> Overall poverty rate: 16.3% — 4th highest
> Median household income: $52,295 a year — 7th lowest
> Population under 18: 22.4% — 22nd highest (total under 18 pop: 1,001,825)

5. Missouri
> Youth (9th-12th grade) obesity rate: 18.4%
> Share of youths who are overweight: 16.1% — 18th highest
> Physically active youths, 5+ days a week: 46.2% — 18th highest
> Communities built to promote physical activity: 68.2% — 16th lowest
> Children (2-19) with easy access to parks and playgrounds: 71.2% — 17th lowest
> Child poverty rate: 17.1% — 19th highest
> Overall poverty rate: 12.9% — 18th highest
> Median household income: $57,409 a year — 13th lowest
> Population under 18: 22.4% — 23rd highest (total under 18 pop: 1,372,695)
4. Tennessee
> Youth (9th-12th grade) obesity rate: 20.9%
> Share of youths who are overweight: 18.3% — 3rd highest
> Physically active youths, 5+ days a week: 44.1% — 22nd highest
> Communities built to promote physical activity: 47.8% — 2nd lowest
> Children (2-19) with easy access to parks and playgrounds: 58.1% — 7th lowest
> Child poverty rate: 19.7% — 9th highest
> Overall poverty rate: 13.9% — 9th highest
> Median household income: $56,071 a year — 9th lowest
> Population under 18: 22.1% — 25th lowest (total under 18 pop: 1,510,752)

3. Arkansas
> Youth (9th-12th grade) obesity rate: 22.1%
> Share of youths who are overweight: 19.8% — 2nd highest
> Physically active youths, 5+ days a week: 35.1% — 12th lowest
> Communities built to promote physical activity: 52.3% — 7th lowest
> Children (2-19) with easy access to parks and playgrounds: 55.1% — 3rd lowest
> Child poverty rate: 22.1% — 4th highest
> Overall poverty rate: 16.2% — 5th highest
> Median household income: $48,952 a year — 3rd lowest
> Population under 18: 23.2% — 15th highest (total under 18 pop: 699,012)
2. West Virginia
> Youth (9th-12th grade) obesity rate: 22.9%
> Share of youths who are overweight: 16.5% — 12th highest
> Physically active youths, 5+ days a week: 44.4% — 21st highest
> Communities built to promote physical activity: 52.1% — 5th lowest
> Children (2-19) with easy access to parks and playgrounds: 56.7% — 6th lowest
> Child poverty rate: 20.1% — 7th highest
> Overall poverty rate: 16.0% — 6th highest
> Median household income: $48,850 a year — 2nd lowest
> Population under 18: 20.0% — 7th lowest (total under 18 pop: 358,818)

1. Mississippi
> Youth (9th-12th grade) obesity rate: 23.4%
> Share of youths who are overweight: 18.0% — 6th highest
> Physically active youths, 5+ days a week: N/A
> Communities built to promote physical activity: 42.0% — the lowest
> Children (2-19) with easy access to parks and playgrounds: 46.4% — the lowest
> Child poverty rate: 28.1% — the highest
> Overall poverty rate: 19.6% — the highest
> Median household income: $45,792 a year — the lowest
> Population under 18: 23.5% — 10th highest (total under 18 pop: 698,420)
Methodology
To determine the states where youth — ninth to 12th graders — are struggling with obesity, 24/7 Tempo reviewed 2019 data from the Youth Risk Behavior Surveillance System. We ranked the states based on the reported youth obesity rate as of 2019, the latest year for which data is available. Eight states — Delaware, Indiana, Massachusetts, Minnesota, Ohio, Oregon, Washington, Wyoming — do not have data on youth obesity from the YRBSS.
Information on the share of youth who are overweight also came from the YRBSS.
The YRBSS is a system of surveys that includes a national-based survey, conducted by the Centers for Disease Control and Prevention, and state, territorial, and tribal agencies and governments and local surveys, conducted by local agencies. The YRBSS monitors six categories of health-related behaviors that contribute to the leading causes of death and disability among youths and adults.
We also reviewed data from the 2018 United States Report Card on Physical Activity for Children and Youth, provided by the National Physical Activity Plan Alliance. The report assesses the levels of physical and sedentary behaviors in American children and youth, facilitators and barriers for physical activity, and health outcomes related to physical activity. Data on communities with infrastructure to promote physical activity such as sidewalks, trails, bike lanes, and paths came from the National Physical Activity Plan Alliance report.
Poverty rates, household income, and population figures were obtained from the U.S. Census Bureau’s American Community Survey and are for 2019.