
Earth is an ocean planet. Water in liquid or frozen form covers 75% of Earth’s surface and fills the sky with clouds. Atmospheric rivers known as jet streams meander and encircle the Earth, contributing to seasonal patterns of rainfall in places across the globe. In many parts of the United States, there is the familiar association of rain with springtime. In other parts of the world, there is always rain.
To identify the rainiest places on Earth, 24/7 Wall St. reviewed average annual rainfall recorded by weather stations around the world and compiled by the Global Historical Climatology Network, a program of the National Centers for Environmental Information (NCEI).
We calculated the average annual rainfall from precipitation in the years 1997 through 2018. Weather stations that did not have at least five years of data available between 1997 and 2018 were not considered.
The most frequently occurring rainiest places on Earth are those in Malaysia and in other South Asian regions. Four places in the United States made our list.

50. Quillayute, WA, United States Of America
> Annual average precipitation (22 years of data): 103.0 inches
> Rainiest year in database: 1999, 131.6 inches
> Rainiest month on average: November, 15.9 inches

49. Miyazaki, Japan
> Annual average precipitation (22 years of data): 104.3 inches
> Rainiest year in database: 2015, 125.8 inches
> Rainiest month on average: June, 20.7 inches

48. Pengkalan Chepa, Malaysia
> Annual average precipitation (22 years of data): 104.5 inches
> Rainiest year in database: 2000, 144.1 inches
> Rainiest month on average: November, 25.0 inches

47. Nankoku, Japan
> Annual average precipitation (16 years of data): 104.9 inches
> Rainiest year in database: 1998, 172.6 inches
> Rainiest month on average: September, 18.7 inches
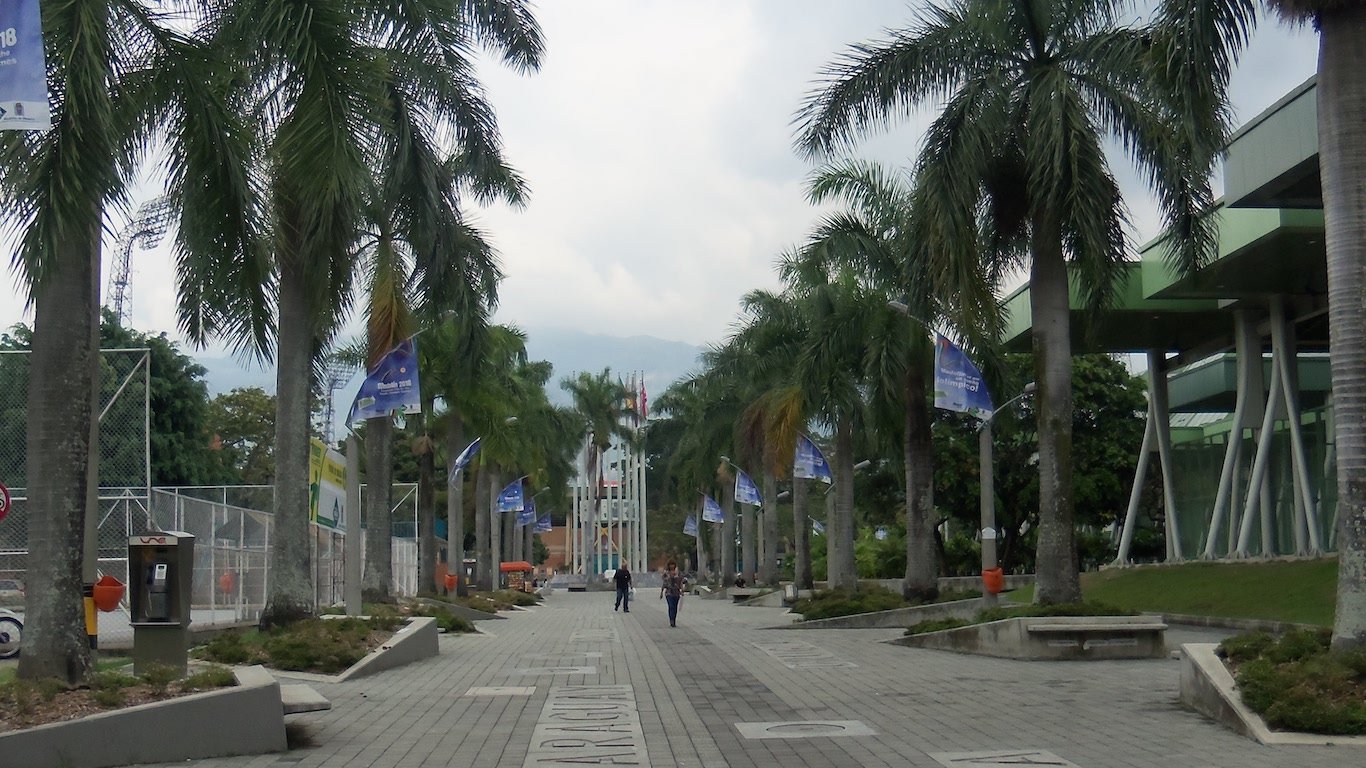
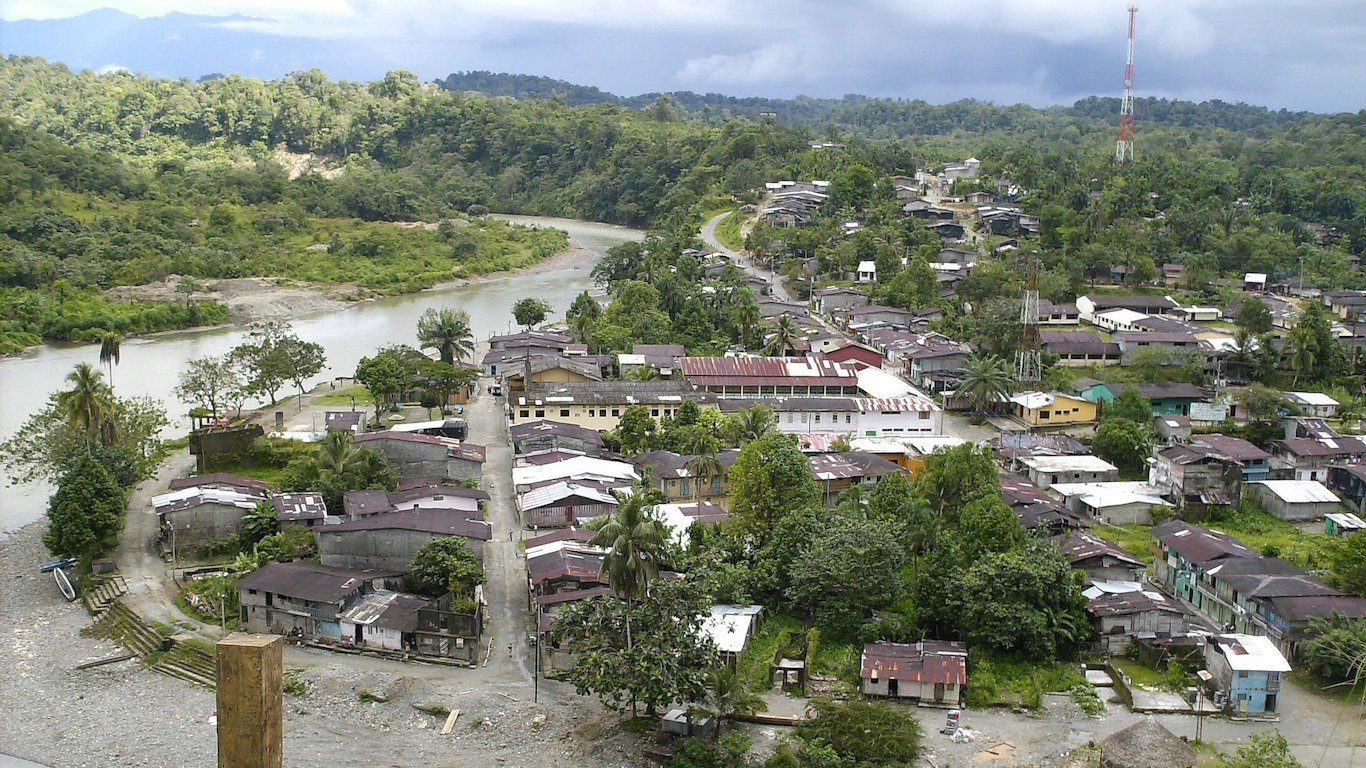
46. Los Laureles, Colombia
> Annual average precipitation (22 years of data): 104.9 inches
> Rainiest year in database: 2010, 148.1 inches
> Rainiest month on average: October, 15.3 inches
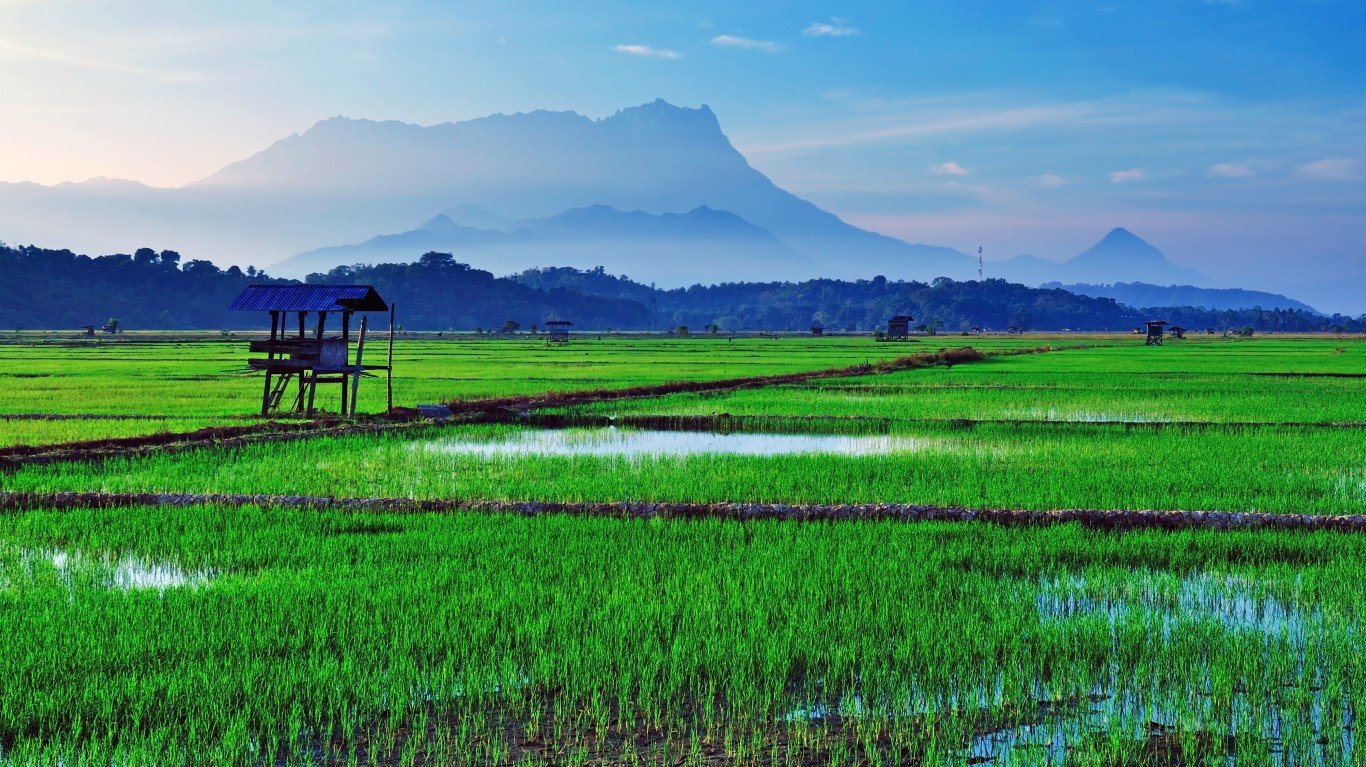
45. Kota Kinabalu, Malaysia
> Annual average precipitation (22 years of data): 106.4 inches
> Rainiest year in database: 2005, 156.5 inches
> Rainiest month on average: October, 15.2 inches
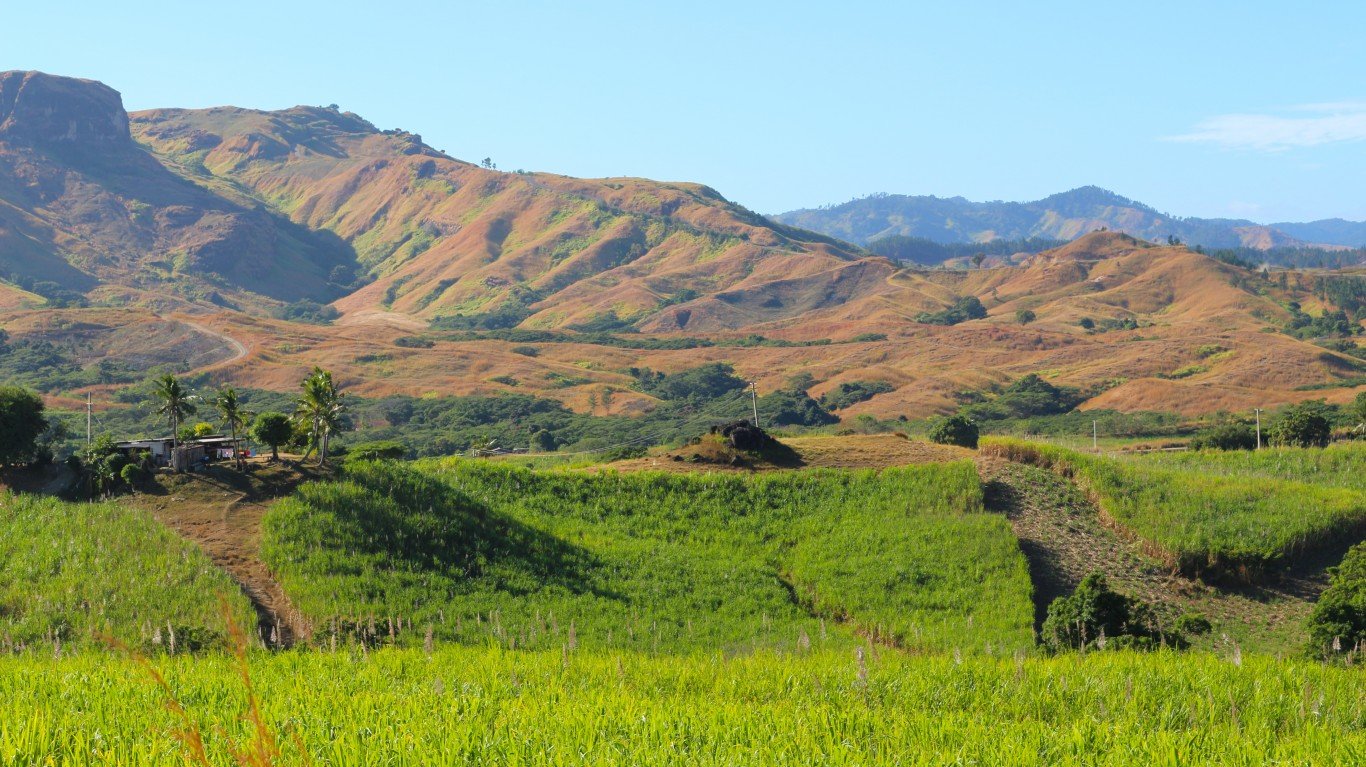
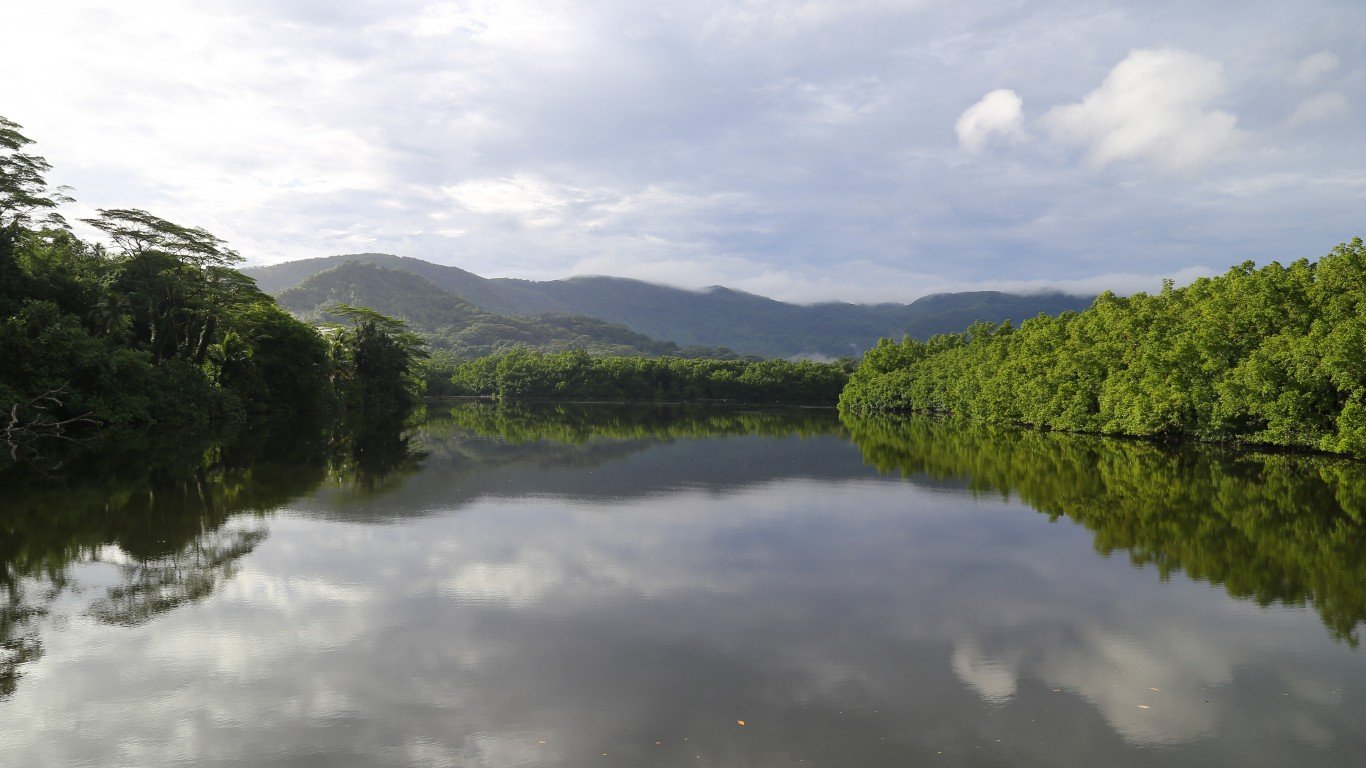
44. Nausori, Fiji
> Annual average precipitation (22 years of data): 106.8 inches
> Rainiest year in database: 1999, 140.3 inches
> Rainiest month on average: December, 14.4 inches
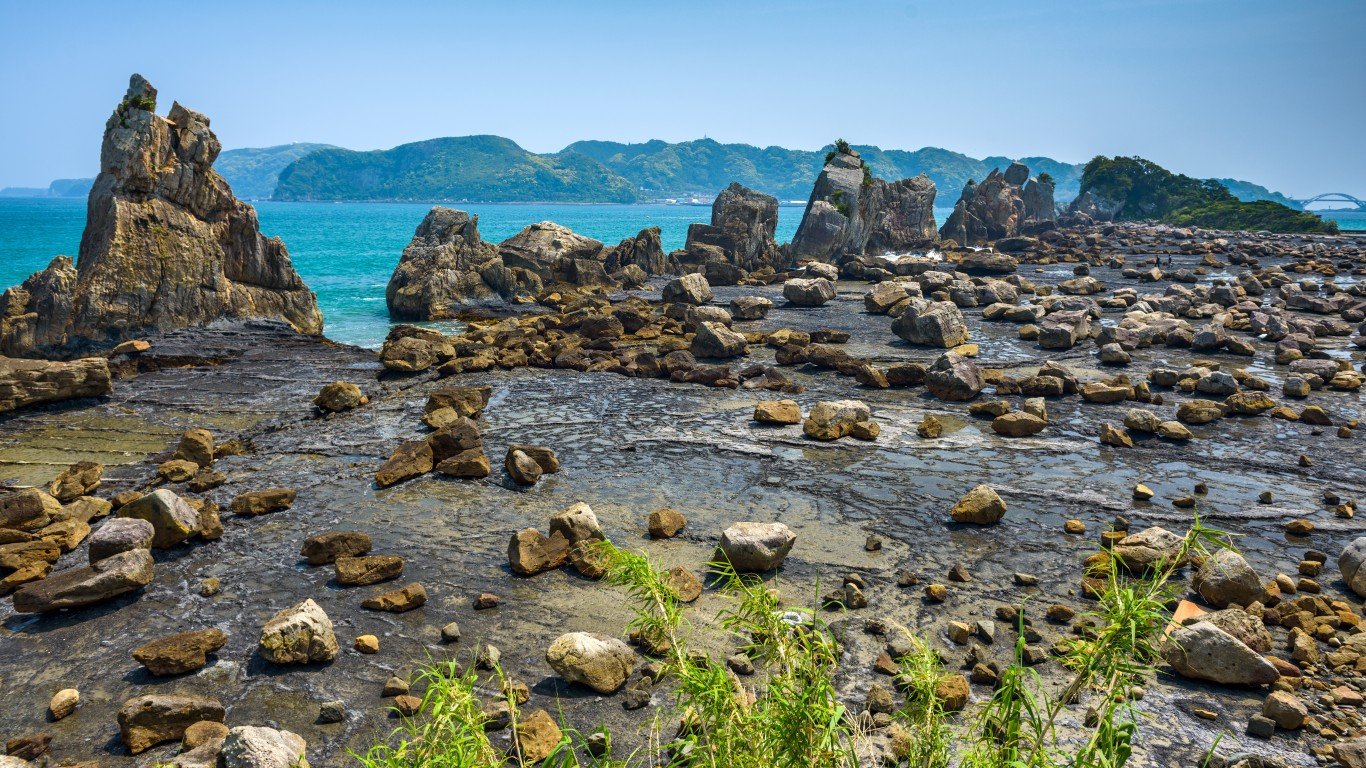
43. Kushimoto, Japan
> Annual average precipitation (22 years of data): 106.9 inches
> Rainiest year in database: 1998, 138.5 inches
> Rainiest month on average: June, 14.9 inches

42. Urnäsch, Switzerland
> Annual average precipitation (22 years of data): 107.9 inches
> Rainiest year in database: 2017, 140.1 inches
> Rainiest month on average: December, 11.9 inches
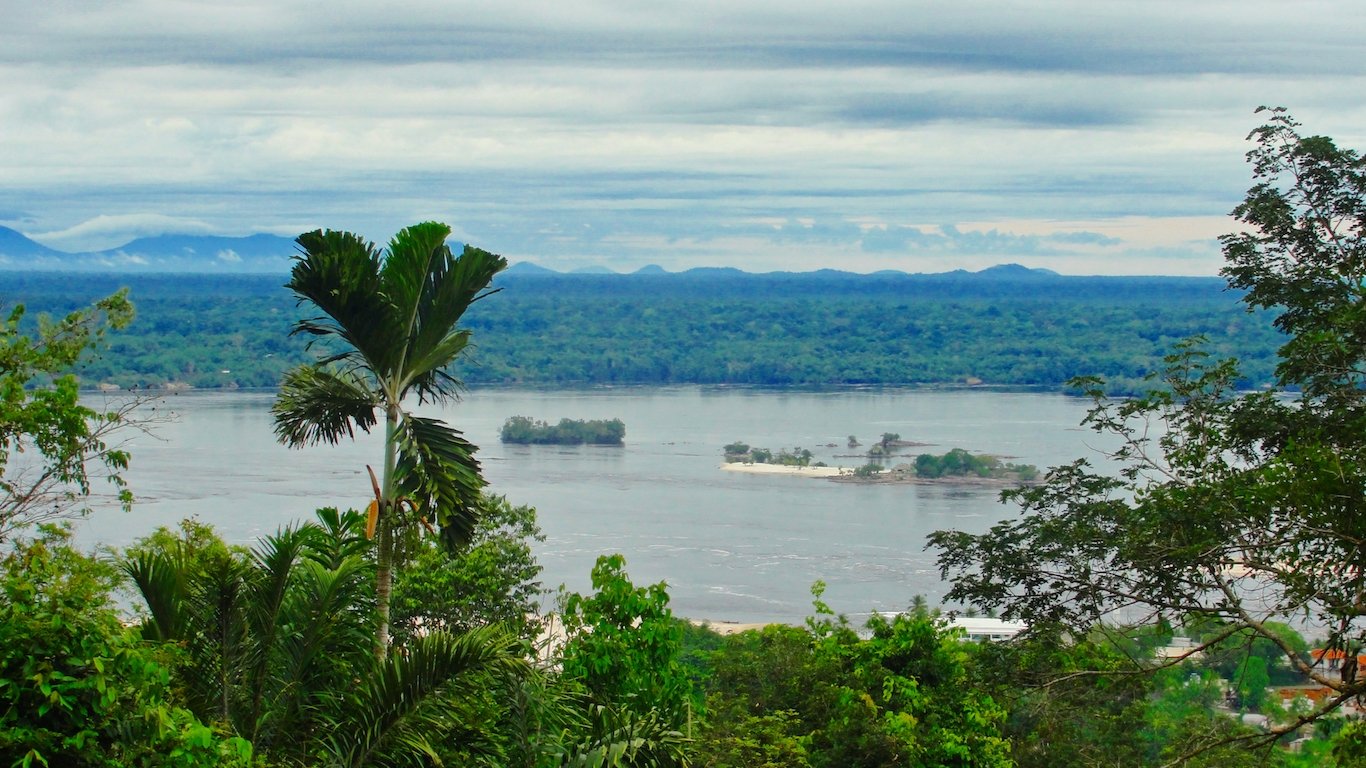
41. Saint Georges, French Guiana (France)
> Annual average precipitation (8 years of data): 108.0 inches
> Rainiest year in database: 2000, 162.0 inches
> Rainiest month on average: May, 23.4 inches
40. Silchar, India
> Annual average precipitation (22 years of data): 109.1 inches
> Rainiest year in database: 2010, 174.6 inches
> Rainiest month on average: June, 20.4 inches
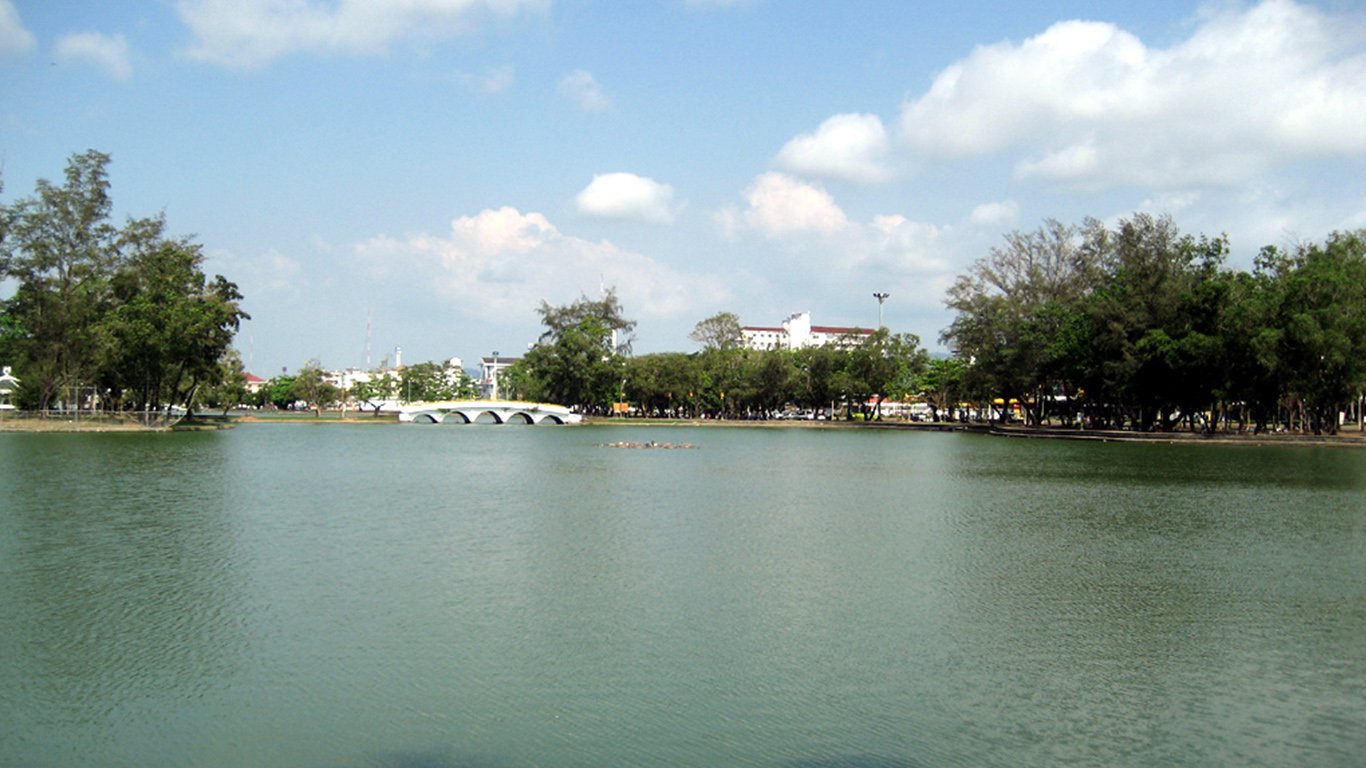
39. Wat Mai, Thailand
> Annual average precipitation (22 years of data): 109.3 inches
> Rainiest year in database: 2006, 153.9 inches
> Rainiest month on average: September, 19.8 inches
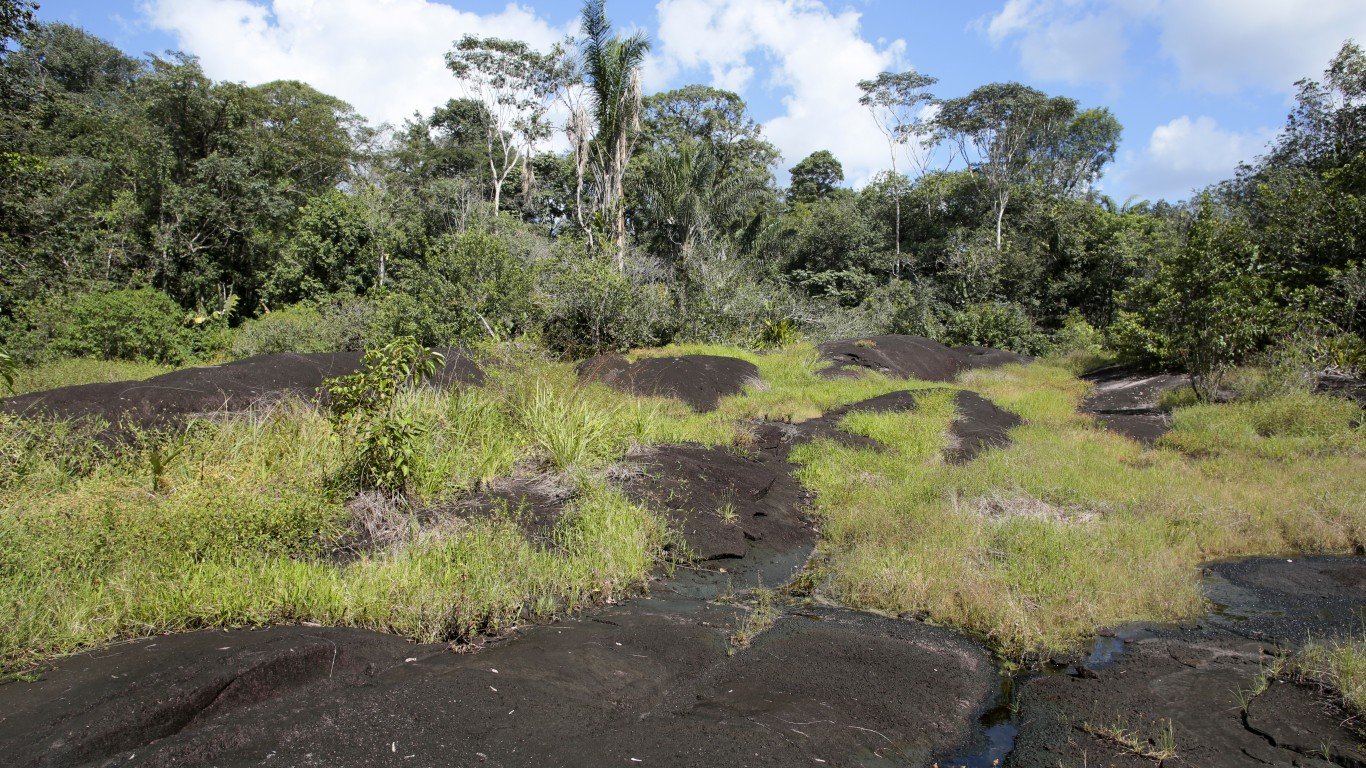
38. São Gabriel da Cachoeira, Brazil
> Annual average precipitation (22 years of data): 110.4 inches
> Rainiest year in database: 2002, 127.2 inches
> Rainiest month on average: May, 14.0 inches

37. Petaling Jaya, Malaysia
> Annual average precipitation (22 years of data): 110.6 inches
> Rainiest year in database: 2006, 136.1 inches
> Rainiest month on average: November, 14.5 inches

36. Miri, Malaysia
> Annual average precipitation (22 years of data): 111.8 inches
> Rainiest year in database: 2018, 128.7 inches
> Rainiest month on average: December, 13.8 inches
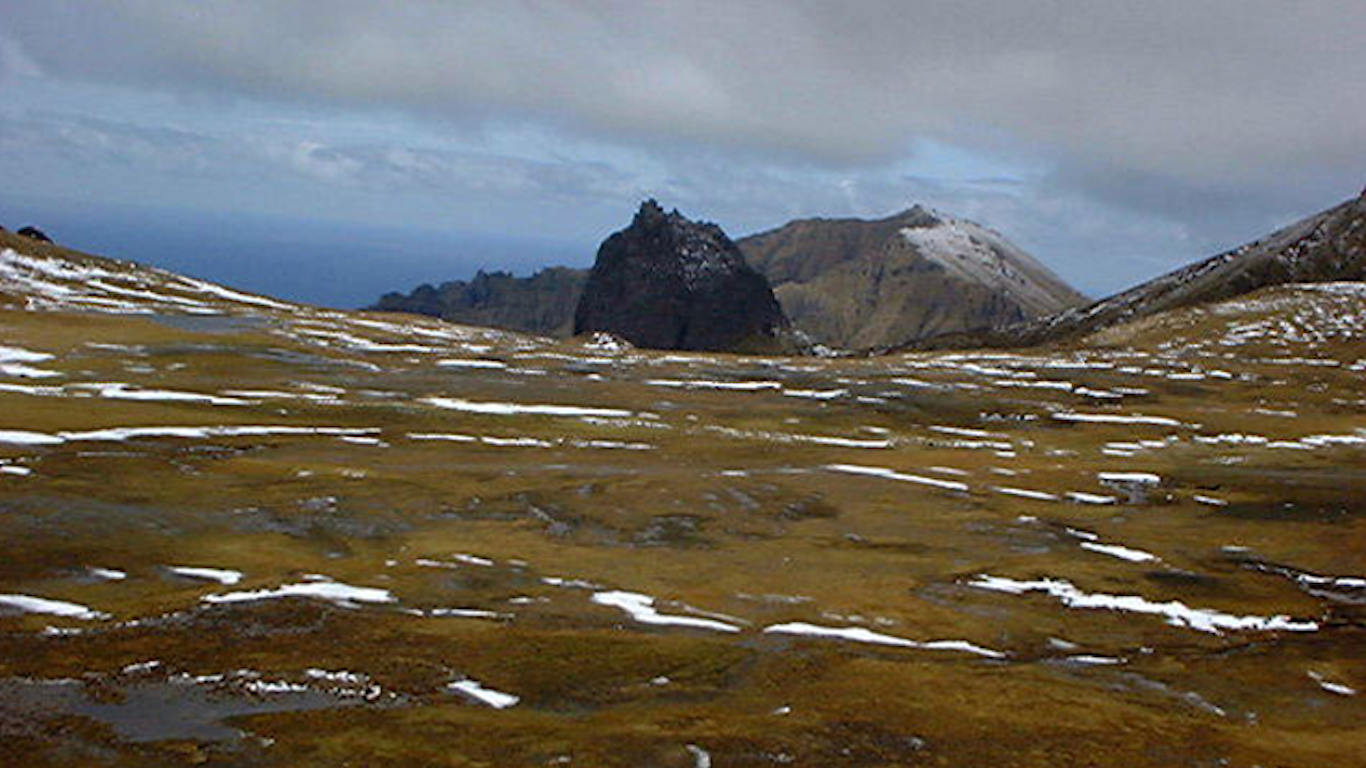
35. Gough (island), South Africa
> Annual average precipitation (22 years of data): 113.7 inches
> Rainiest year in database: 1997, 140.8 inches
> Rainiest month on average: June, 13.0 inches

34. Panaji, India
> Annual average precipitation (22 years of data): 113.9 inches
> Rainiest year in database: 2007, 145.3 inches
> Rainiest month on average: June, 36.3 inches

33. Baguio, Philippines
> Annual average precipitation (22 years of data): 114.0 inches
> Rainiest year in database: 2009, 241.6 inches
> Rainiest month on average: August, 36.7 inches
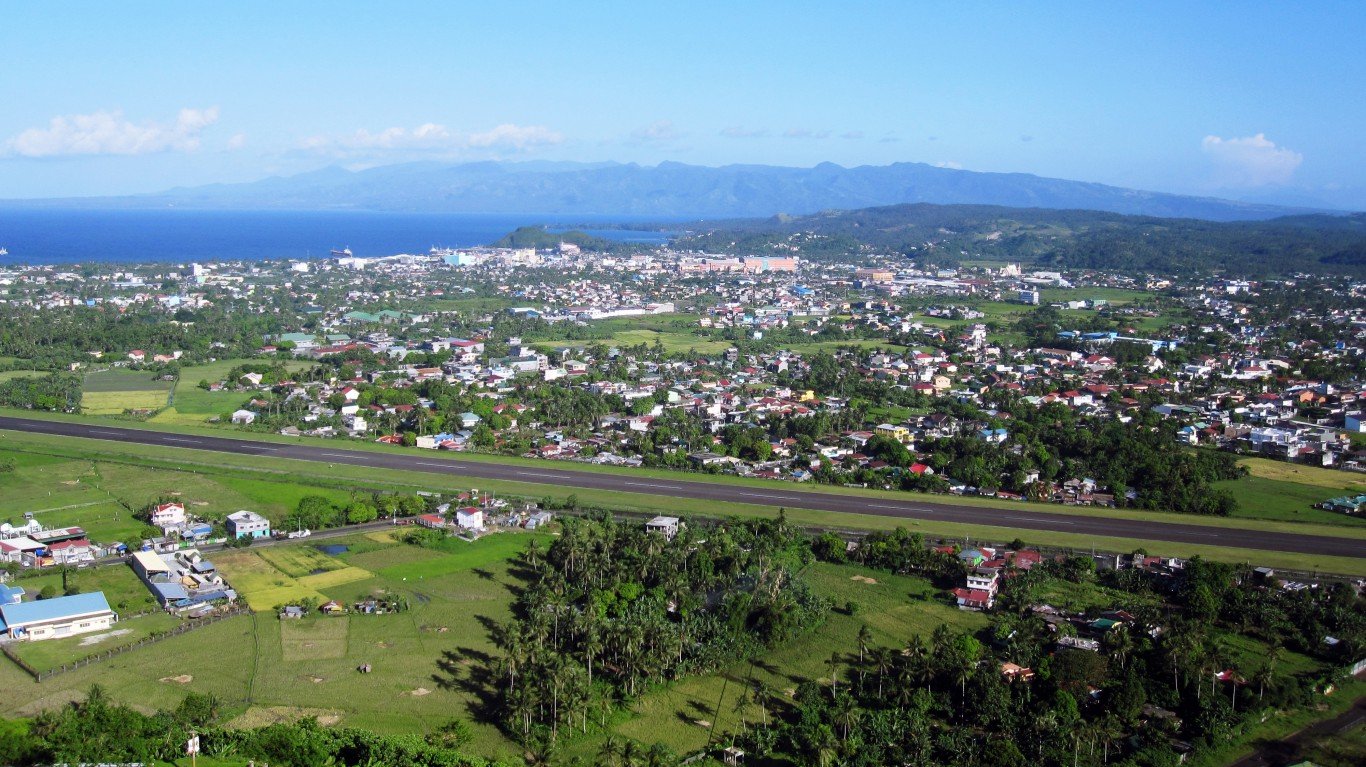
32. Legazpi City, Philippines
> Annual average precipitation (22 years of data): 114.5 inches
> Rainiest year in database: 2008, 168.5 inches
> Rainiest month on average: December, 24.4 inches
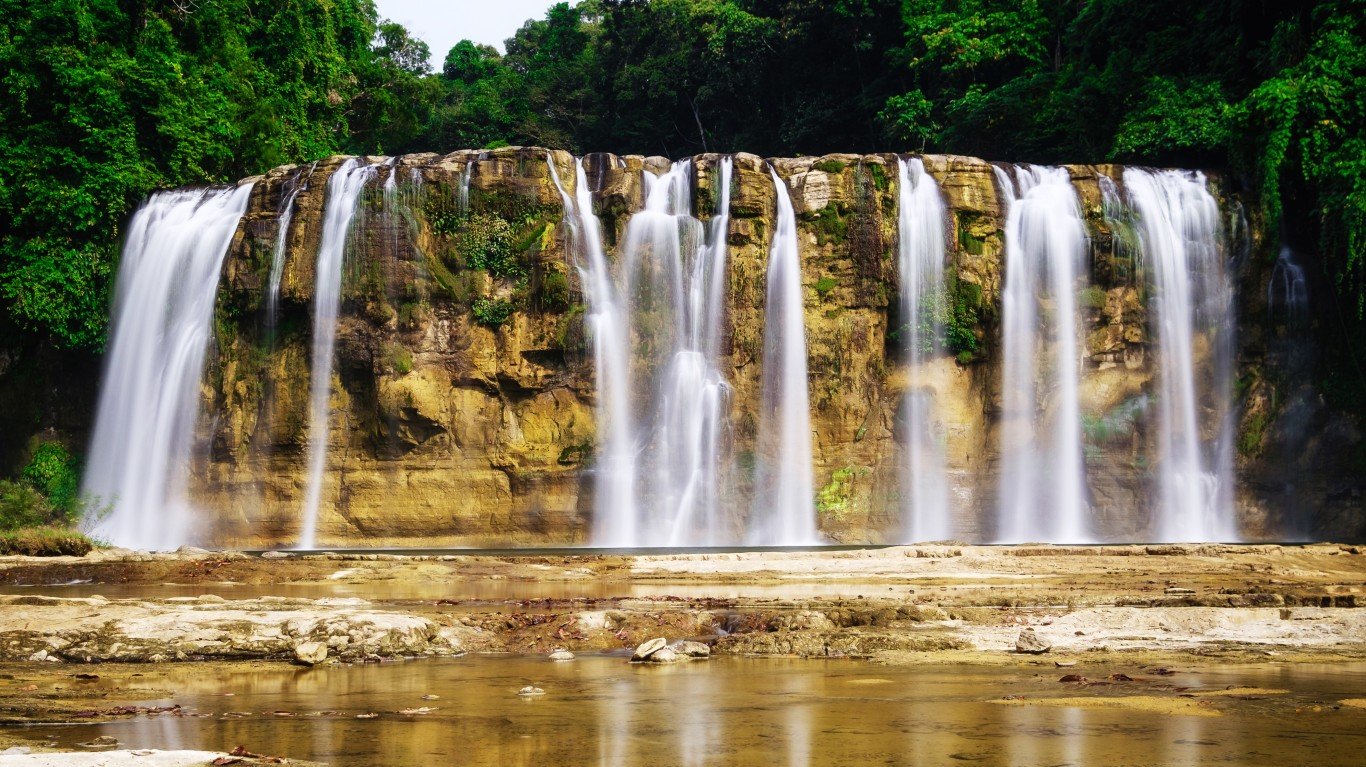
31. Surigao, Philippines
> Annual average precipitation (22 years of data): 114.6 inches
> Rainiest year in database: 2017, 174.7 inches
> Rainiest month on average: January, 28.3 inches

30. Kuantan, Malaysia
> Annual average precipitation (22 years of data): 115.1 inches
> Rainiest year in database: 2003, 149.4 inches
> Rainiest month on average: December, 28.8 inches
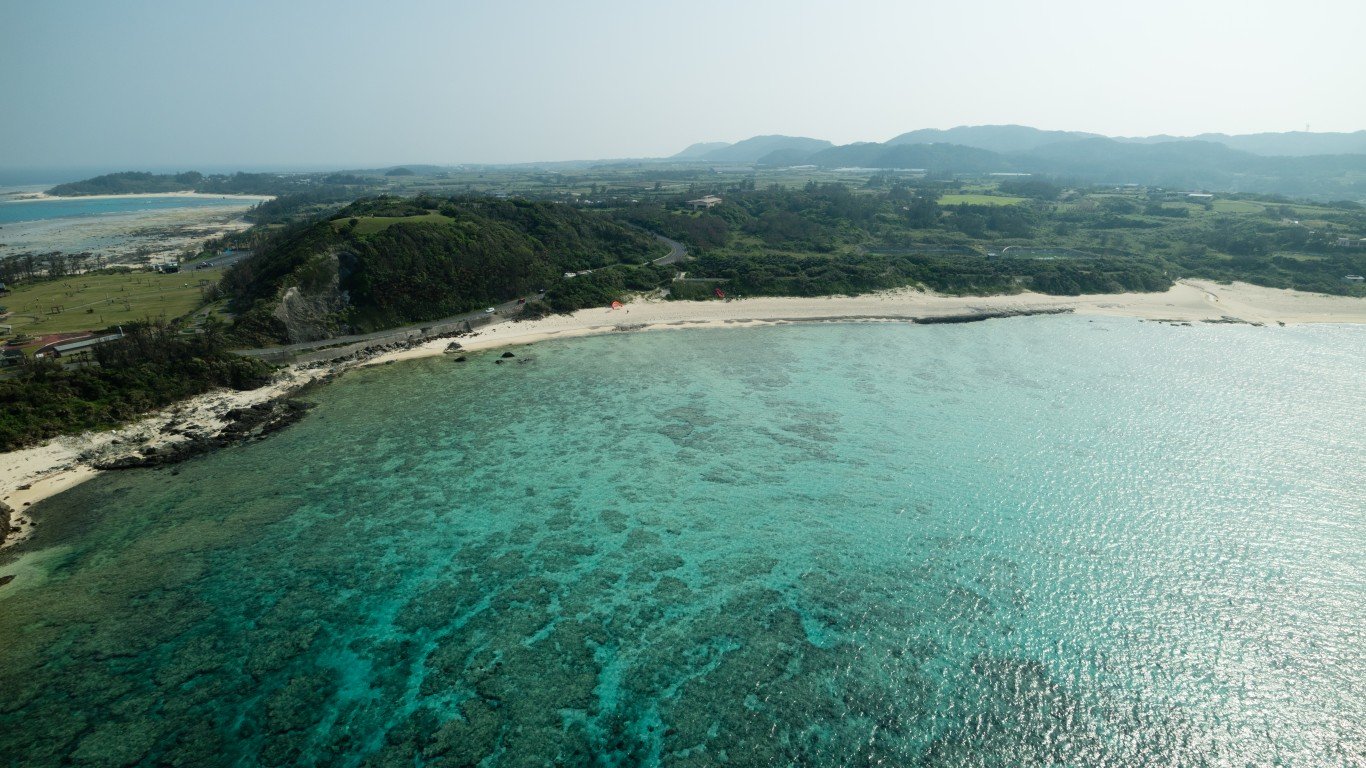
29. Amami, Japan
> Annual average precipitation (22 years of data): 116.8 inches
> Rainiest year in database: 1998, 173.5 inches
> Rainiest month on average: June, 17.3 inches

28. Forks, WA, United States Of America
> Annual average precipitation (10 years of data): 117.2 inches
> Rainiest year in database: 1997, 162.2 inches
> Rainiest month on average: January, 21.0 inches

27. Andaman and Nicobar Islands, India
> Annual average precipitation (22 years of data): 118.2 inches
> Rainiest year in database: 2008, 163.5 inches
> Rainiest month on average: September, 19.6 inches
26. Kozhikode, India
> Annual average precipitation (22 years of data): 118.3 inches
> Rainiest year in database: 2007, 170.9 inches
> Rainiest month on average: June, 30.9 inches
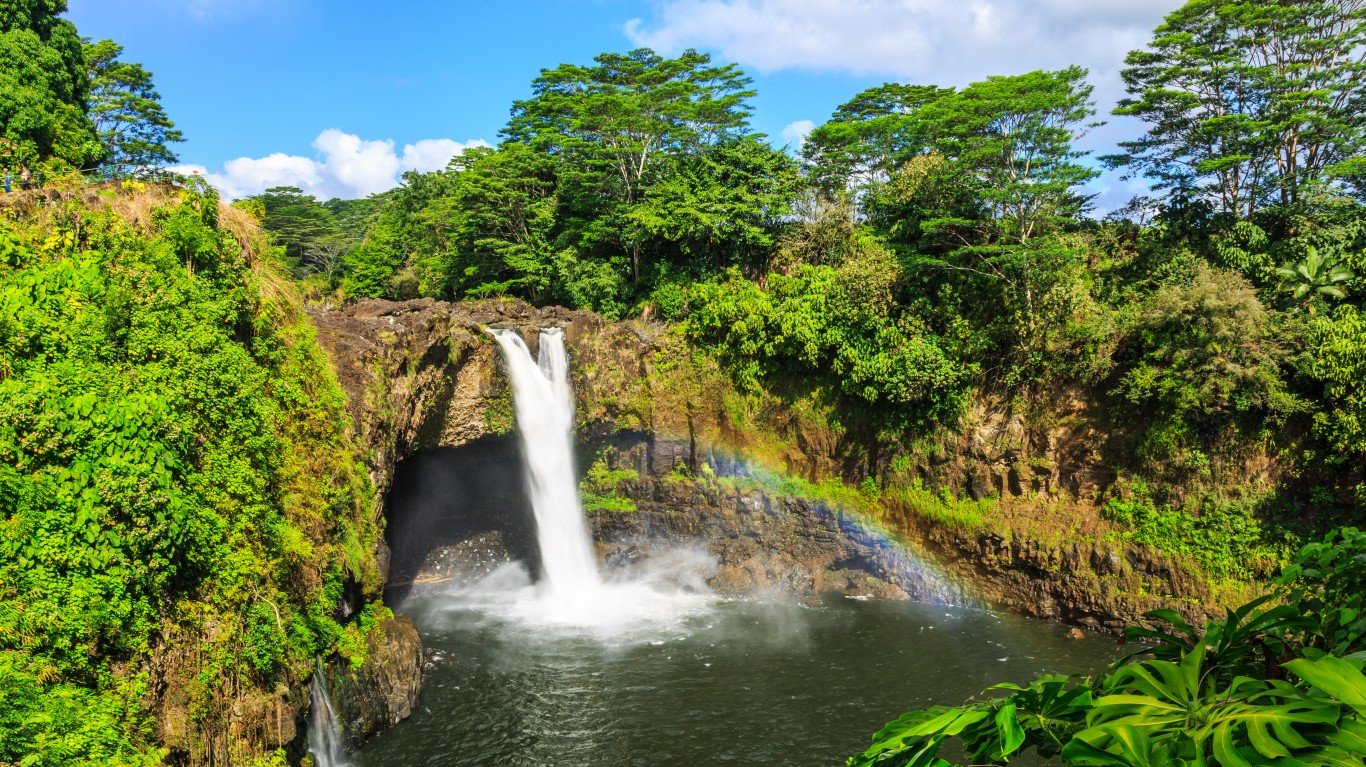
25. Hilo, Hi, United States Of America
> Annual average precipitation (22 years of data): 118.5 inches
> Rainiest year in database: 2018, 172.0 inches
> Rainiest month on average: November, 13.7 inches

24. Leticia, Colombia
> Annual average precipitation (22 years of data): 119.4 inches
> Rainiest year in database: 2014, 155.0 inches
> Rainiest month on average: January, 15.3 inches
23. Rotuma island, Fiji
> Annual average precipitation (22 years of data): 120.9 inches
> Rainiest year in database: 2006, 172.4 inches
> Rainiest month on average: January, 14.3 inches
22. Colonia, Federated States Of Micronesia
> Annual average precipitation (22 years of data): 123.1 inches
> Rainiest year in database: 2011, 158.7 inches
> Rainiest month on average: August, 15.7 inches

21. Majuro (island), Marshall Islands
> Annual average precipitation (22 years of data): 124.9 inches
> Rainiest year in database: 2018, 171.7 inches
> Rainiest month on average: October, 13.4 inches

20. Juneau, AK, United States Of America
> Annual average precipitation (22 years of data): 125.1 inches
> Rainiest year in database: 2005, 161.9 inches
> Rainiest month on average: September, 18.5 inches

19. Sandakan, Malaysia
> Annual average precipitation (22 years of data): 126.3 inches
> Rainiest year in database: 2011, 212.5 inches
> Rainiest month on average: January, 18.3 inches

18. Limón, Costa Rica
> Annual average precipitation (22 years of data): 126.9 inches
> Rainiest year in database: 2004, 178.3 inches
> Rainiest month on average: December, 17.6 inches

17. Hachijō, Japan
> Annual average precipitation (22 years of data): 127.1 inches
> Rainiest year in database: 1998, 181.4 inches
> Rainiest month on average: October, 16.9 inches
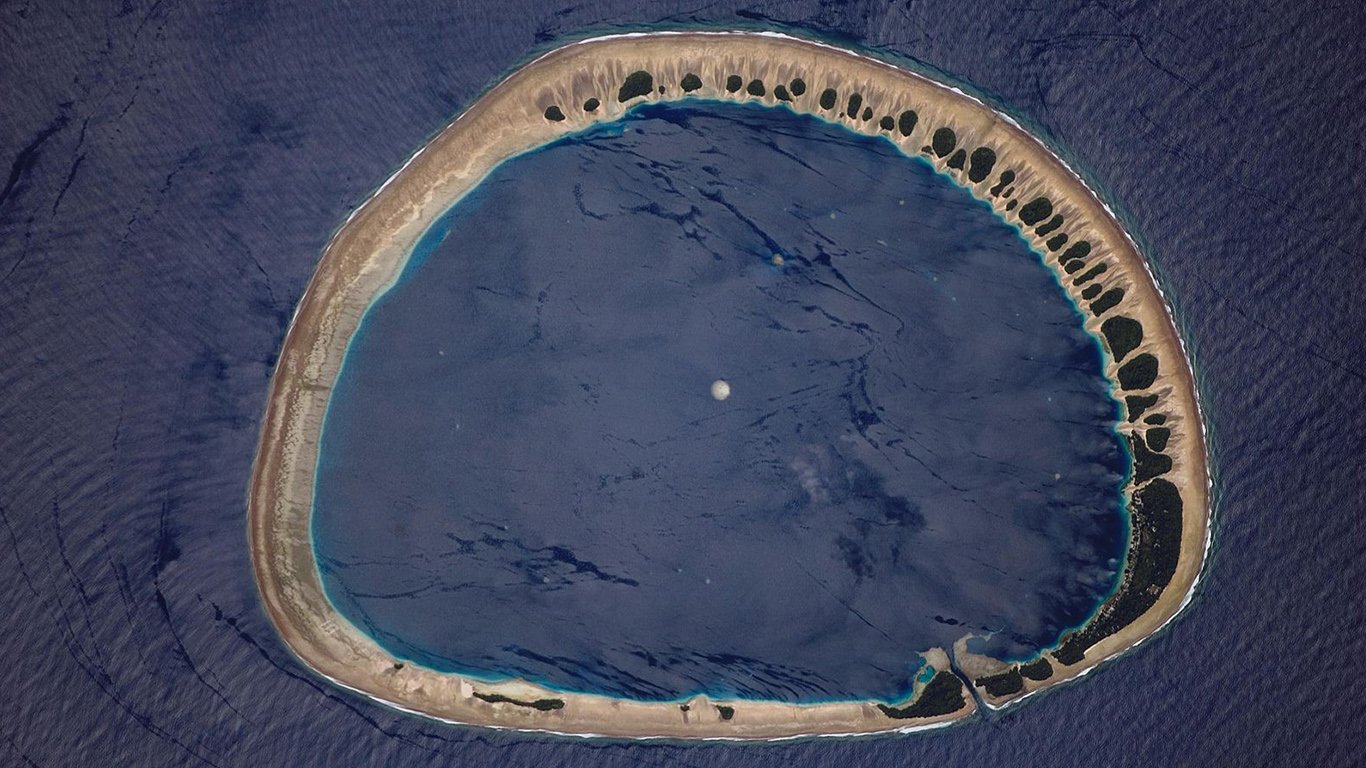
16. Nukuoro Atoll, Federated States Of Micronesia
> Annual average precipitation (9 years of data): 128.0 inches
> Rainiest year in database: 1999, 225.1 inches
> Rainiest month on average: March, 16.2 inches

15. Pingelap Atoll, Federated States Of Micronesia
> Annual average precipitation (9 years of data): 128.6 inches
> Rainiest year in database: 1999, 220.3 inches
> Rainiest month on average: August, 17.1 inches

14. Belém, Brazil
> Annual average precipitation (22 years of data): 128.8 inches
> Rainiest year in database: 2018, 150.8 inches
> Rainiest month on average: March, 19.5 inches
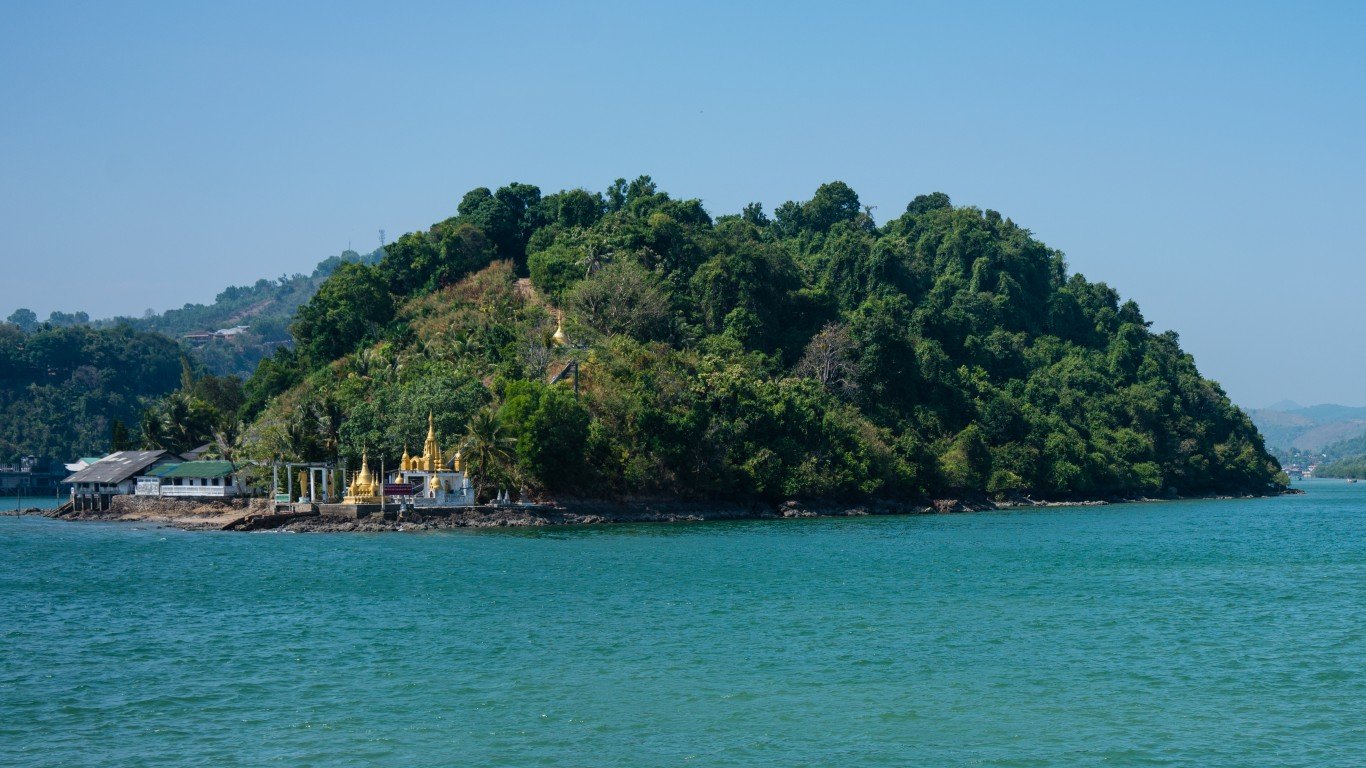
13. Kawthoung, Myanmar
> Annual average precipitation (9 years of data): 131.8 inches
> Rainiest year in database: 2013, 194.3 inches
> Rainiest month on average: July, 36.7 inches
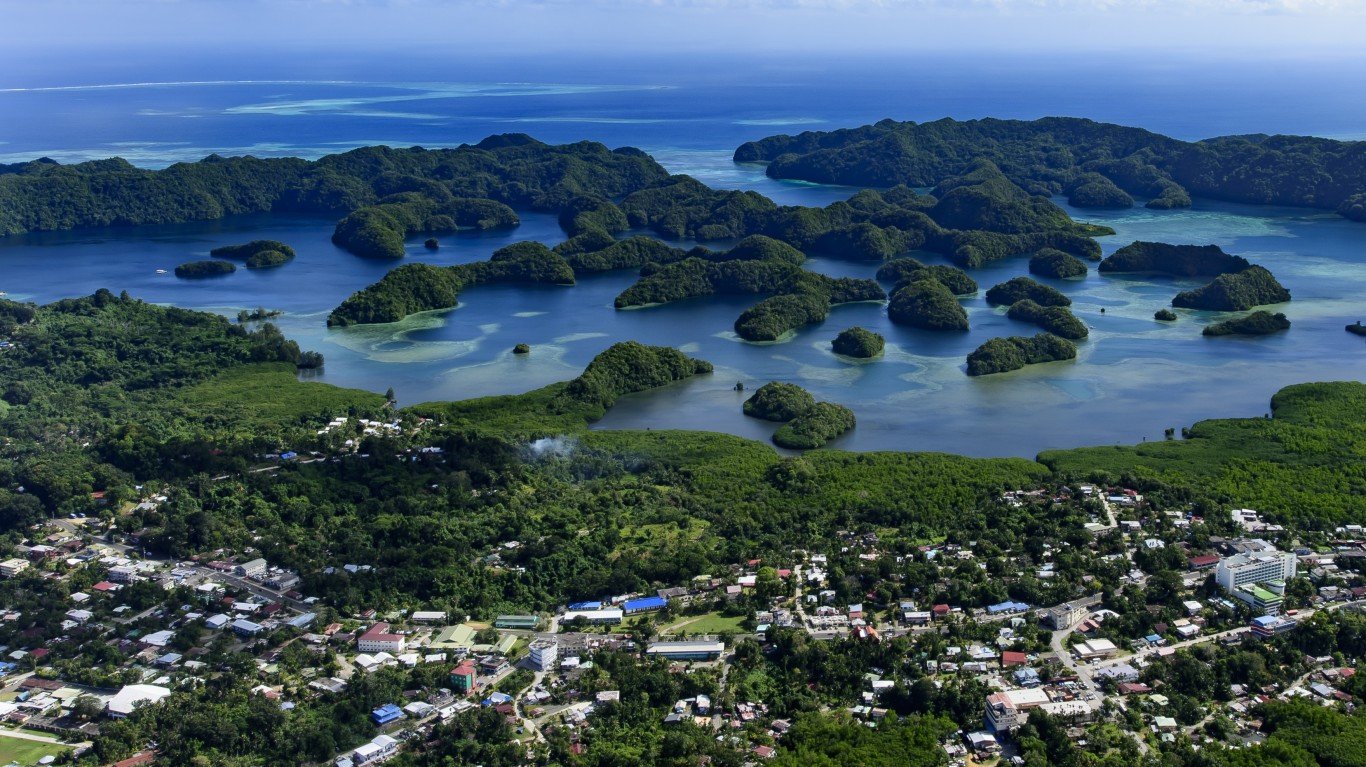
12. Koror Island, Belau
> Annual average precipitation (22 years of data): 133.5 inches
> Rainiest year in database: 2011, 190.0 inches
> Rainiest month on average: June, 16.2 inches

11. Innisfail, Australia
> Annual average precipitation (9 years of data): 138.4 inches
> Rainiest year in database: 1999, 227.8 inches
> Rainiest month on average: March, 23.5 inches

10. Cayenne, French Guiana
> Annual average precipitation (22 years of data): 139.8 inches
> Rainiest year in database: 2006, 173.1 inches
> Rainiest month on average: May, 23.4 inches

9. Sibu, Malaysia
> Annual average precipitation (22 years of data): 140.3 inches
> Rainiest year in database: 2016, 192.8 inches
> Rainiest month on average: January, 19.0 inches

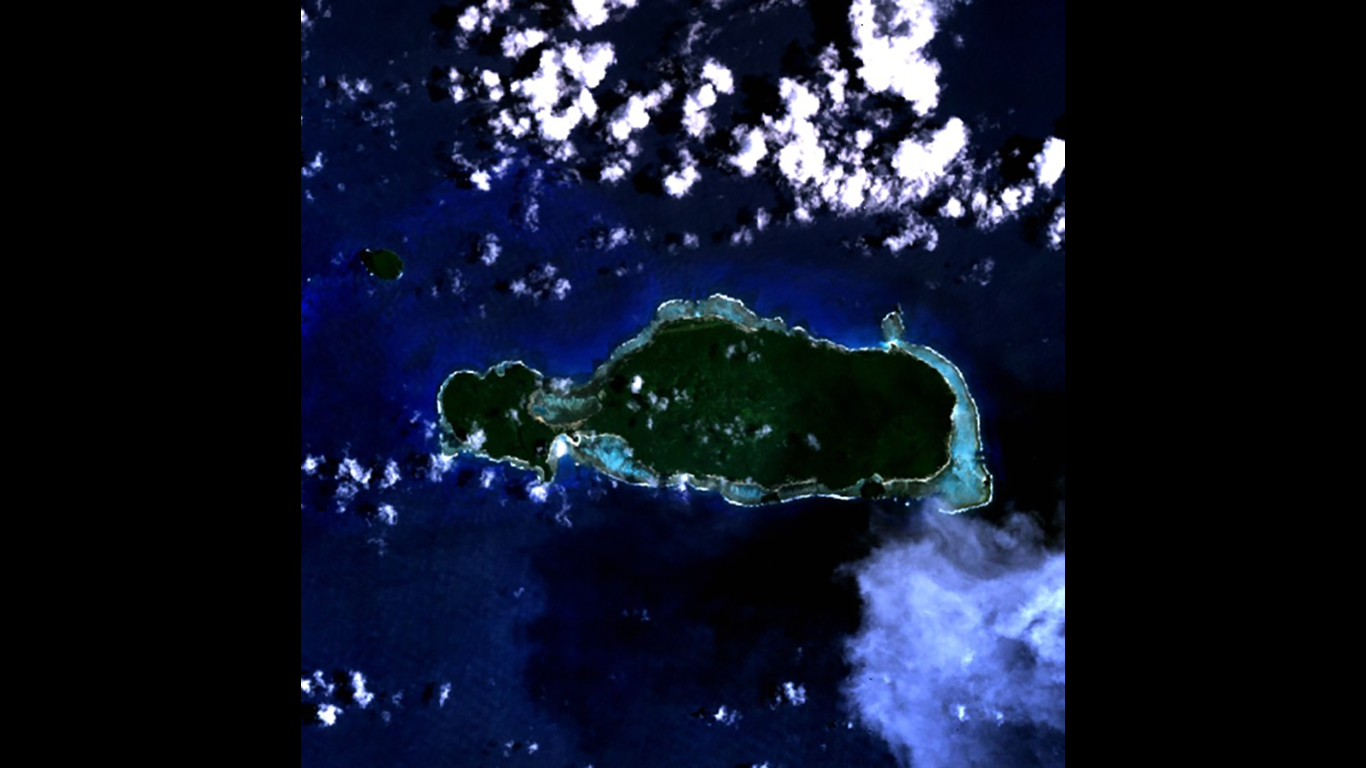
8. Fono Island, Federated States Of Micronesia
> Annual average precipitation (22 years of data): 140.5 inches
> Rainiest year in database: 2002, 171.0 inches
> Rainiest month on average: September, 14.9 inches

7. Sittwe, Myanmar
> Annual average precipitation (11 years of data): 145.9 inches
> Rainiest year in database: 2004, 224.0 inches
> Rainiest month on average: July, 52.5 inches

6. Villavicencio, Colombia
> Annual average precipitation (22 years of data): 147.6 inches
> Rainiest year in database: 2010, 202.1 inches
> Rainiest month on average: May, 23.3 inches

5. Bintulu, Malaysia
> Annual average precipitation (22 years of data): 153.2 inches
> Rainiest year in database: 2008, 212.0 inches
> Rainiest month on average: January, 19.8 inches
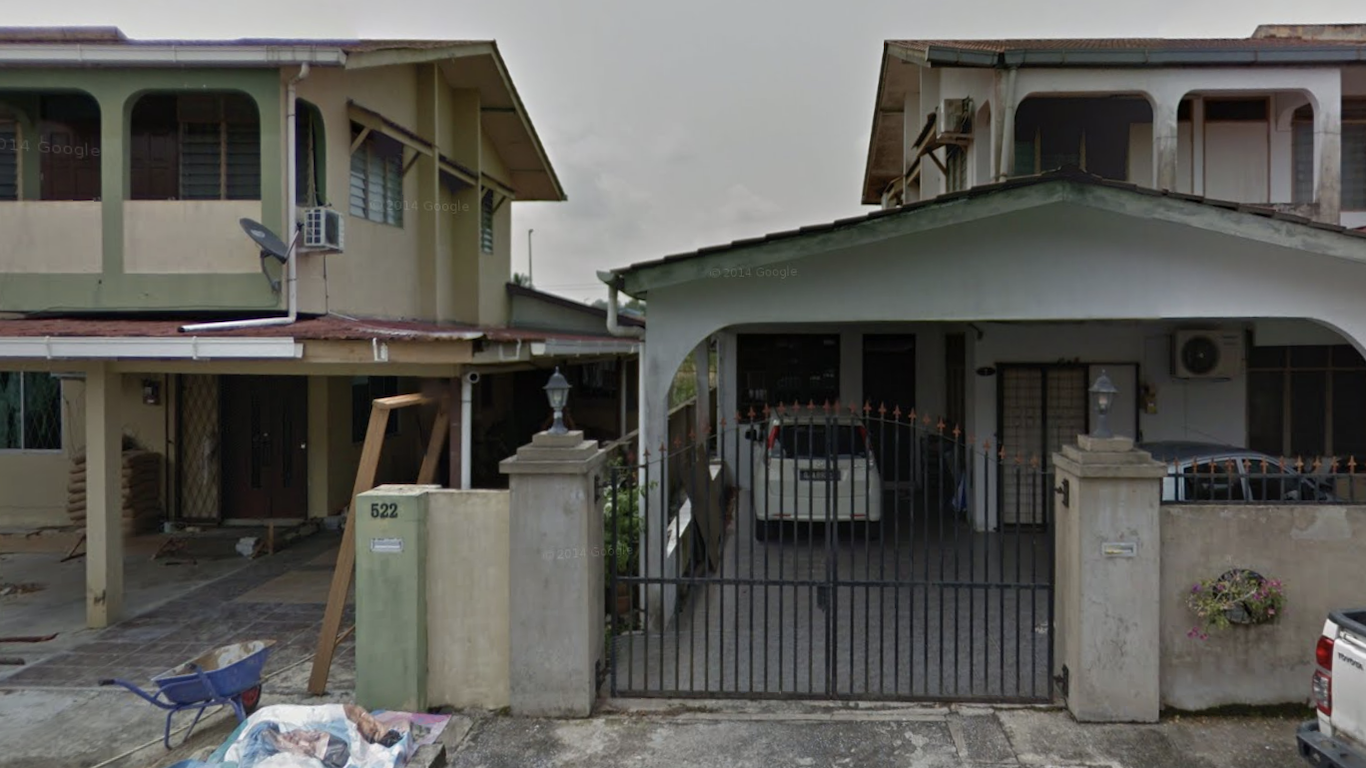
4. Taman Desa Wira, Malaysia
> Annual average precipitation (22 years of data): 166.2 inches
> Rainiest year in database: 2003, 206.7 inches
> Rainiest month on average: January, 27.3 inches
3. Kolonia, Federated States Of Micronesia
> Annual average precipitation (22 years of data): 168.7 inches
> Rainiest year in database: 2018, 209.0 inches
> Rainiest month on average: April, 17.5 inches
2. Bagadó, Colombia
> Annual average precipitation (9 years of data): 258.9 inches
> Rainiest year in database: 2000, 344.9 inches
> Rainiest month on average: August, 34.6 inches
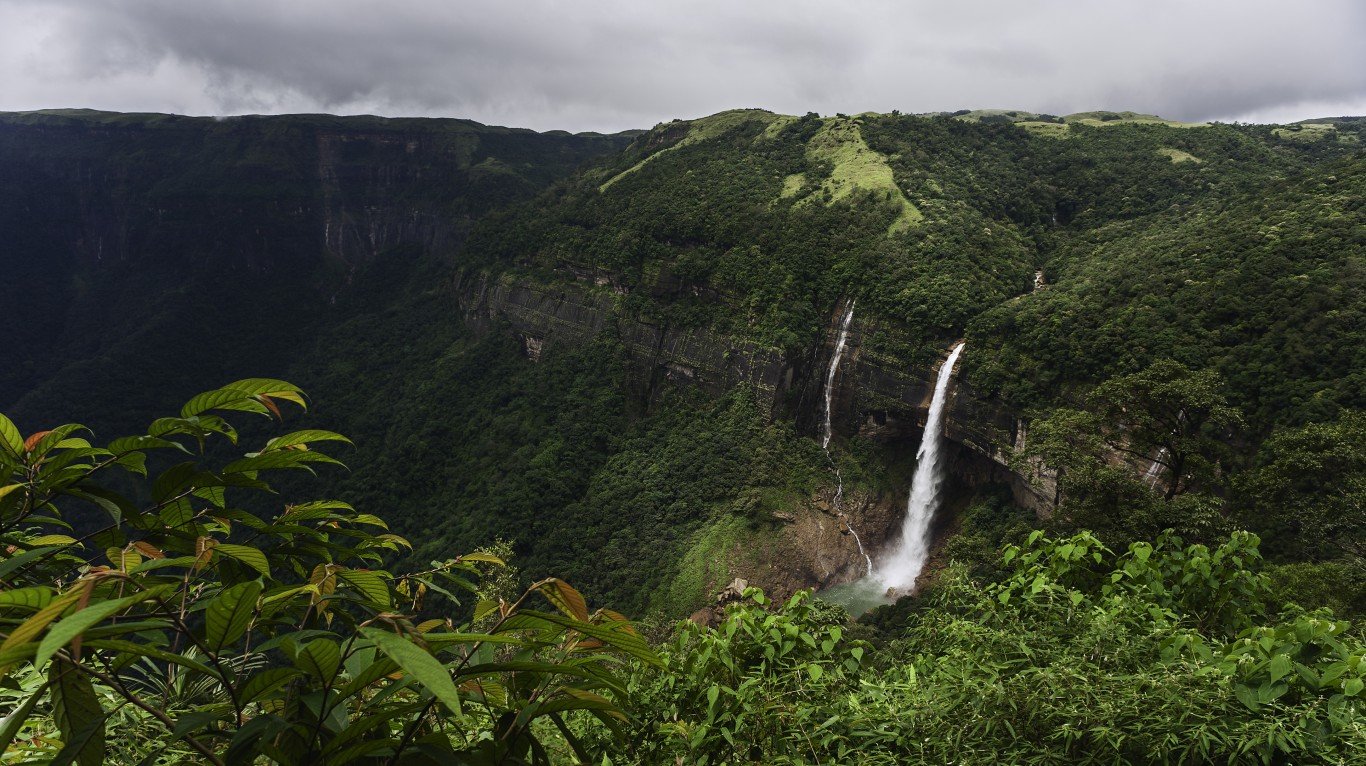
1. Cherrapunji, India
> Annual average precipitation (22 years of data): 382.2 inches
> Rainiest year in database: 2010, 530.4 inches
> Rainiest month on average: July, 97.2 inches