
For over 25 years, opioid addiction has raged throughout the United States, transcending boundaries of race, income, and age to bring harm to Americans in both small towns and bustling cities throughout the country. The opioid epidemic has brought profound despair to individuals, communities, and society as a whole, and been responsible for hundreds of thousands of deaths – causing an unprecedented decline in U.S. life expectancy and an economic burden of over $1 trillion a year. (These are the fastest-growing causes of death in America.)
The epidemic is the result of a massive failure at nearly every level of the U.S. healthcare system, from Big Pharma’s deceptive marketing of opioids to clinicians overprescribing them through both irresponsible overtreatment and blatant fraud.
While the opioid epidemic has affected all Americans, it has disproportionately impacted poor rural communities, where opioid prescription rates and ultimately drug overdose deaths are highest.
To determine the places where the most opioids are prescribed, 24/7 Tempo reviewed data on opioid dispensation from the Centers for Disease Control and Prevention. Counties and county equivalents (independent cities in Virginia) were ranked based on the opioid prescriptions dispensed per capita in 2020. Prescriptions are based on the location of the prescriber rather than the location of the pharmacy. Data on average annual drug overdoses per capita came from the CDC and is for the years 2018 through 2021. Supplemental data on median household income and population is from the U.S. Census Bureau’s 2021 American Community Survey and reflects five-year estimates.
In 2020, there were more opioid prescriptions dispensed than there were people in 112 counties. In the place with the highest opioid dispensation rate – Norton, Virginia – more than four opioid prescriptions were dispensed for every resident. The places with the highest opioid prescription rates tend to be impoverished rural communities in the South, where access to quality healthcare treatment is lower and the prevalence of chronic pain higher. In 45 of the 50 counties with the highest opioid dispensation rate (2020)s, the poverty rate is higher than the 12.6% national figure. (Here’s a list of the counties with the worst drug problem in every state.)
Higher opioid prescription rates are also directly linked to higher rates of opioid abuse. According to one study published in the peer-reviewed American Journal of Psychiatry in April 2022, for every county-level increase in the opioid dispensation rate (in 2020) of 35 prescriptions per 100 residents, the odds of an individual in that county being addicted to prescription opioids increases by 10%.
As prescription opioids become less effective or more difficult to obtain over time, patients may seek out heroin or fentanyl in illicit drug markets, vastly increasing their drug dependence and risk of overdose. And with roughly 80% new heroin users reporting pills as their initiation to opioid use, residents in counties with more opioid prescriptions per capita may be at a greater risk of overdose than in other parts of the country.

50. Florence County, South Carolina
> Opioid dispensation rate (2020): 125.0 prescriptions per 100 residents
> Drug overdose rate (opioid and non-opioid, 2018-2021): 28.3 deaths per 100,000 residents (#647 of 3,143 counties)
> Poverty rate: 17.6% (#765 of 3,143 counties)
> Population: 137,276 (#472 of 3,143 counties)
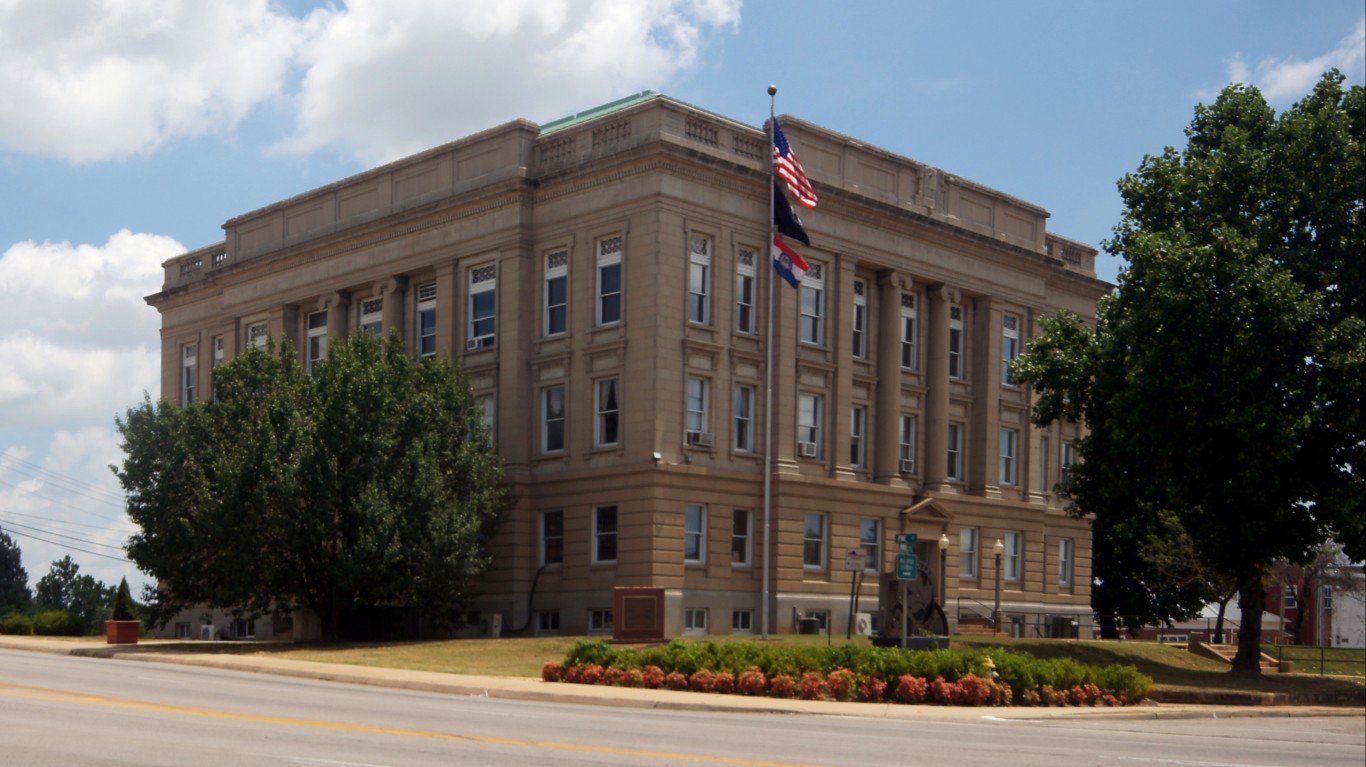
49. Butler County, Missouri
> Opioid dispensation rate (2020): 125.4 prescriptions per 100 residents
> Drug overdose rate (opioid and non-opioid, 2018-2021): 38.4 deaths per 100,000 residents (#306 of 3,143 counties)
> Poverty rate: 21.3% (#392 of 3,143 counties)
> Population: 42,314 (#1,135 of 3,143 counties)

48. Bibb County, Georgia
> Opioid dispensation rate (2020): 125.6 prescriptions per 100 residents
> Drug overdose rate (opioid and non-opioid, 2018-2021): 11.5 deaths per 100,000 residents (#1,774 of 3,143 counties)
> Poverty rate: 25.2% (#171 of 3,143 counties)
> Population: 156,711 (#428 of 3,143 counties)

47. Carbon County, Utah
> Opioid dispensation rate (2020): 125.9 prescriptions per 100 residents
> Drug overdose rate (opioid and non-opioid, 2018-2021): 24.4 deaths per 100,000 residents (#847 of 3,143 counties)
> Poverty rate: 16.3% (#991 of 3,143 counties)
> Population: 20,208 (#1,809 of 3,143 counties)

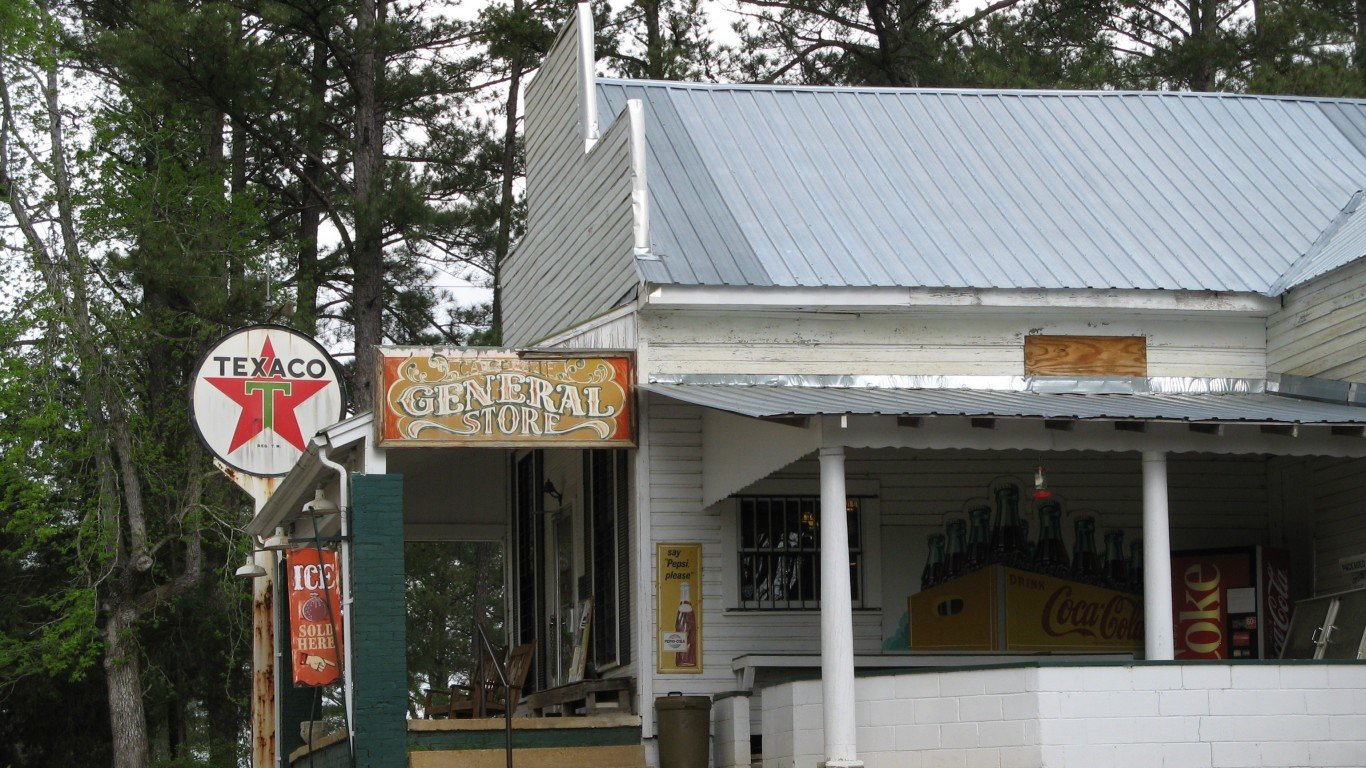
46. Love County, Oklahoma
> Opioid dispensation rate (2020): 126.2 prescriptions per 100 residents
> Drug overdose rate (opioid and non-opioid, 2018-2021): 26.9 deaths per 100,000 residents (#713 of 3,143 counties)
> Poverty rate: 15.2% (#1,167 of 3,143 counties)
> Population: 10,105 (#2,401 of 3,143 counties)

45. Sullivan County, Tennessee
> Opioid dispensation rate (2020): 126.4 prescriptions per 100 residents
> Drug overdose rate (opioid and non-opioid, 2018-2021): 32.2 deaths per 100,000 residents (#491 of 3,143 counties)
> Poverty rate: 15.6% (#1,102 of 3,143 counties)
> Population: 157,843 (#424 of 3,143 counties)

44. Saline County, Illinois
> Opioid dispensation rate (2020): 129.7 prescriptions per 100 residents
> Drug overdose rate (opioid and non-opioid, 2018-2021): 26.6 deaths per 100,000 residents (#725 of 3,143 counties)
> Poverty rate: 17.0% (#861 of 3,143 counties)
> Population: 23,869 (#1,644 of 3,143 counties)

43. Bacon County, Georgia
> Opioid dispensation rate (2020): 131.3 prescriptions per 100 residents
> Drug overdose rate (opioid and non-opioid, 2018-2021): 22.5 deaths per 100,000 residents (#982 of 3,143 counties)
> Poverty rate: 24.5% (#202 of 3,143 counties)
> Population: 11,163 (#2,337 of 3,143 counties)

42. Independence County, Arkansas
> Opioid dispensation rate (2020): 132.5 prescriptions per 100 residents
> Drug overdose rate (opioid and non-opioid, 2018-2021): 9.3 deaths per 100,000 residents (#1,902 of 3,143 counties)
> Poverty rate: 17.7% (#762 of 3,143 counties)
> Population: 37,796 (#1,229 of 3,143 counties)

41. Whitley County, Kentucky
> Opioid dispensation rate (2020): 132.8 prescriptions per 100 residents
> Drug overdose rate (opioid and non-opioid, 2018-2021): 34.3 deaths per 100,000 residents (#403 of 3,143 counties)
> Poverty rate: 21.6% (#364 of 3,143 counties)
> Population: 36,578 (#1,265 of 3,143 counties)

40. Floyd County, Kentucky
> Opioid dispensation rate (2020): 133.4 prescriptions per 100 residents
> Drug overdose rate (opioid and non-opioid, 2018-2021): 55.1 deaths per 100,000 residents (#83 of 3,143 counties)
> Poverty rate: 29.0% (#73 of 3,143 counties)
> Population: 36,127 (#1,278 of 3,143 counties)

39. Caddo Parish, Louisiana
> Opioid dispensation rate (2020): 134.5 prescriptions per 100 residents
> Drug overdose rate (opioid and non-opioid, 2018-2021): 12.5 deaths per 100,000 residents (#1,700 of 3,143 counties)
> Poverty rate: 23.0% (#271 of 3,143 counties)
> Population: 239,775 (#282 of 3,143 counties)

38. Clarke County, Georgia
> Opioid dispensation rate (2020): 136.3 prescriptions per 100 residents
> Drug overdose rate (opioid and non-opioid, 2018-2021): 14.1 deaths per 100,000 residents (#1,589 of 3,143 counties)
> Poverty rate: 26.2% (#132 of 3,143 counties)
> Population: 128,195 (#503 of 3,143 counties)

37. Houston County, Alabama
> Opioid dispensation rate (2020): 136.5 prescriptions per 100 residents
> Drug overdose rate (opioid and non-opioid, 2018-2021): 12.7 deaths per 100,000 residents (#1,687 of 3,143 counties)
> Poverty rate: 17.7% (#760 of 3,143 counties)
> Population: 106,355 (#573 of 3,143 counties)

36. Baxter County, Arkansas
> Opioid dispensation rate (2020): 136.7 prescriptions per 100 residents
> Drug overdose rate (opioid and non-opioid, 2018-2021): 11.3 deaths per 100,000 residents (#1,795 of 3,143 counties)
> Poverty rate: 14.0% (#1,416 of 3,143 counties)
> Population: 41,476 (#1,149 of 3,143 counties)

35. Coffee County, Tennessee
> Opioid dispensation rate (2020): 138.1 prescriptions per 100 residents
> Drug overdose rate (opioid and non-opioid, 2018-2021): 33.2 deaths per 100,000 residents (#445 of 3,143 counties)
> Poverty rate: 16.0% (#1,023 of 3,143 counties)
> Population: 57,227 (#907 of 3,143 counties)

34. Columbia County, Washington
> Opioid dispensation rate (2020): 138.2 prescriptions per 100 residents
> Drug overdose rate (opioid and non-opioid, 2018-2021): N/A
> Poverty rate: 9.3% (#2,508 of 3,143 counties)
> Population: 3,969 (#2,886 of 3,143 counties)

33. Clay County, Kentucky
> Opioid dispensation rate (2020): 138.3 prescriptions per 100 residents
> Drug overdose rate (opioid and non-opioid, 2018-2021): 45.1 deaths per 100,000 residents (#186 of 3,143 counties)
> Poverty rate: 33.6% (#33 of 3,143 counties)
> Population: 20,484 (#1,795 of 3,143 counties)

32. Jefferson County, Alabama
> Opioid dispensation rate (2020): 139.0 prescriptions per 100 residents
> Drug overdose rate (opioid and non-opioid, 2018-2021): 37.4 deaths per 100,000 residents (#327 of 3,143 counties)
> Poverty rate: 15.9% (#1,044 of 3,143 counties)
> Population: 672,550 (#101 of 3,143 counties)

31. Bell County, Kentucky
> Opioid dispensation rate (2020): 140.0 prescriptions per 100 residents
> Drug overdose rate (opioid and non-opioid, 2018-2021): 44.1 deaths per 100,000 residents (#203 of 3,143 counties)
> Poverty rate: 28.3% (#83 of 3,143 counties)
> Population: 24,674 (#1,619 of 3,143 counties)

30. Washington County, Tennessee
> Opioid dispensation rate (2020): 140.1 prescriptions per 100 residents
> Drug overdose rate (opioid and non-opioid, 2018-2021): 27.4 deaths per 100,000 residents (#694 of 3,143 counties)
> Poverty rate: 15.3% (#1,141 of 3,143 counties)
> Population: 132,067 (#486 of 3,143 counties)

29. Pulaski County, Arkansas
> Opioid dispensation rate (2020): 141.7 prescriptions per 100 residents
> Drug overdose rate (opioid and non-opioid, 2018-2021): 24.7 deaths per 100,000 residents (#830 of 3,143 counties)
> Poverty rate: 15.8% (#1,059 of 3,143 counties)
> Population: 397,931 (#180 of 3,143 counties)

28. Coffee County, Georgia
> Opioid dispensation rate (2020): 142.4 prescriptions per 100 residents
> Drug overdose rate (opioid and non-opioid, 2018-2021): 15.6 deaths per 100,000 residents (#1,459 of 3,143 counties)
> Poverty rate: 22.2% (#315 of 3,143 counties)
> Population: 43,048 (#1,117 of 3,143 counties)

27. Scott County, Virginia
> Opioid dispensation rate (2020): 142.9 prescriptions per 100 residents
> Drug overdose rate (opioid and non-opioid, 2018-2021): 24.4 deaths per 100,000 residents (#851 of 3,143 counties)
> Poverty rate: 15.4% (#1,138 of 3,143 counties)
> Population: 21,576 (#1,736 of 3,143 counties)

26. Madison County, Tennessee
> Opioid dispensation rate (2020): 145.1 prescriptions per 100 residents
> Drug overdose rate (opioid and non-opioid, 2018-2021): 20.1 deaths per 100,000 residents (#1,135 of 3,143 counties)
> Poverty rate: 18.7% (#621 of 3,143 counties)
> Population: 98,373 (#612 of 3,143 counties)

25. Vanderburgh County, Indiana
> Opioid dispensation rate (2020): 146.1 prescriptions per 100 residents
> Drug overdose rate (opioid and non-opioid, 2018-2021): 27.9 deaths per 100,000 residents (#671 of 3,143 counties)
> Poverty rate: 15.2% (#1,160 of 3,143 counties)
> Population: 179,695 (#373 of 3,143 counties)

24. Scott County, Indiana
> Opioid dispensation rate (2020): 147.1 prescriptions per 100 residents
> Drug overdose rate (opioid and non-opioid, 2018-2021): 59.4 deaths per 100,000 residents (#60 of 3,143 counties)
> Poverty rate: 16.6% (#934 of 3,143 counties)
> Population: 24,290 (#1,632 of 3,143 counties)

23. Floyd County, Georgia
> Opioid dispensation rate (2020): 148.7 prescriptions per 100 residents
> Drug overdose rate (opioid and non-opioid, 2018-2021): 21.8 deaths per 100,000 residents (#1,014 of 3,143 counties)
> Poverty rate: 18.7% (#628 of 3,143 counties)
> Population: 98,210 (#613 of 3,143 counties)

22. Colbert County, Alabama
> Opioid dispensation rate (2020): 150.0 prescriptions per 100 residents
> Drug overdose rate (opioid and non-opioid, 2018-2021): 15.3 deaths per 100,000 residents (#1,488 of 3,143 counties)
> Poverty rate: 15.1% (#1,193 of 3,143 counties)
> Population: 56,789 (#910 of 3,143 counties)

21. Cheyenne County, Kansas
> Opioid dispensation rate (2020): 150.1 prescriptions per 100 residents
> Drug overdose rate (opioid and non-opioid, 2018-2021): N/A
> Poverty rate: 15.8% (#1,067 of 3,143 counties)
> Population: 2,647 (#2,972 of 3,143 counties)

20. Charlottesville city, Virginia
> Opioid dispensation rate (2020): 153.8 prescriptions per 100 residents
> Drug overdose rate (opioid and non-opioid, 2018-2021): 16.5 deaths per 100,000 residents (#1,394 of 3,143 counties)
> Poverty rate: 23.1% (#265 of 3,143 counties)
> Population: 46,597 (#1,038 of 3,143 counties)
19. Lauderdale County, Mississippi
> Opioid dispensation rate (2020): 157.7 prescriptions per 100 residents
> Drug overdose rate (opioid and non-opioid, 2018-2021): 9.1 deaths per 100,000 residents (#1,910 of 3,143 counties)
> Poverty rate: 23.8% (#229 of 3,143 counties)
> Population: 73,756 (#748 of 3,143 counties)

18. Hardin County, Illinois
> Opioid dispensation rate (2020): 159.5 prescriptions per 100 residents
> Drug overdose rate (opioid and non-opioid, 2018-2021): N/A
> Poverty rate: 12.4% (#1,778 of 3,143 counties)
> Population: 3,700 (#2,900 of 3,143 counties)
17. Ware County, Georgia
> Opioid dispensation rate (2020): 160.1 prescriptions per 100 residents
> Drug overdose rate (opioid and non-opioid, 2018-2021): 21.6 deaths per 100,000 residents (#1,028 of 3,143 counties)
> Poverty rate: 23.8% (#225 of 3,143 counties)
> Population: 36,084 (#1,280 of 3,143 counties)

16. Craighead County, Arkansas
> Opioid dispensation rate (2020): 164.0 prescriptions per 100 residents
> Drug overdose rate (opioid and non-opioid, 2018-2021): 8.8 deaths per 100,000 residents (#1,923 of 3,143 counties)
> Poverty rate: 17.8% (#741 of 3,143 counties)
> Population: 109,875 (#556 of 3,143 counties)

15. Harmon County, Oklahoma
> Opioid dispensation rate (2020): 171.3 prescriptions per 100 residents
> Drug overdose rate (opioid and non-opioid, 2018-2021): N/A
> Poverty rate: 17.6% (#776 of 3,143 counties)
> Population: 2,540 (#2,982 of 3,143 counties)

14. Tift County, Georgia
> Opioid dispensation rate (2020): 181.6 prescriptions per 100 residents
> Drug overdose rate (opioid and non-opioid, 2018-2021): 15.9 deaths per 100,000 residents (#1,439 of 3,143 counties)
> Poverty rate: 22.1% (#326 of 3,143 counties)
> Population: 41,148 (#1,153 of 3,143 counties)

13. Clark County, Kentucky
> Opioid dispensation rate (2020): 188.1 prescriptions per 100 residents
> Drug overdose rate (opioid and non-opioid, 2018-2021): 62.4 deaths per 100,000 residents (#50 of 3,143 counties)
> Poverty rate: 14.1% (#1,391 of 3,143 counties)
> Population: 36,716 (#1,261 of 3,143 counties)
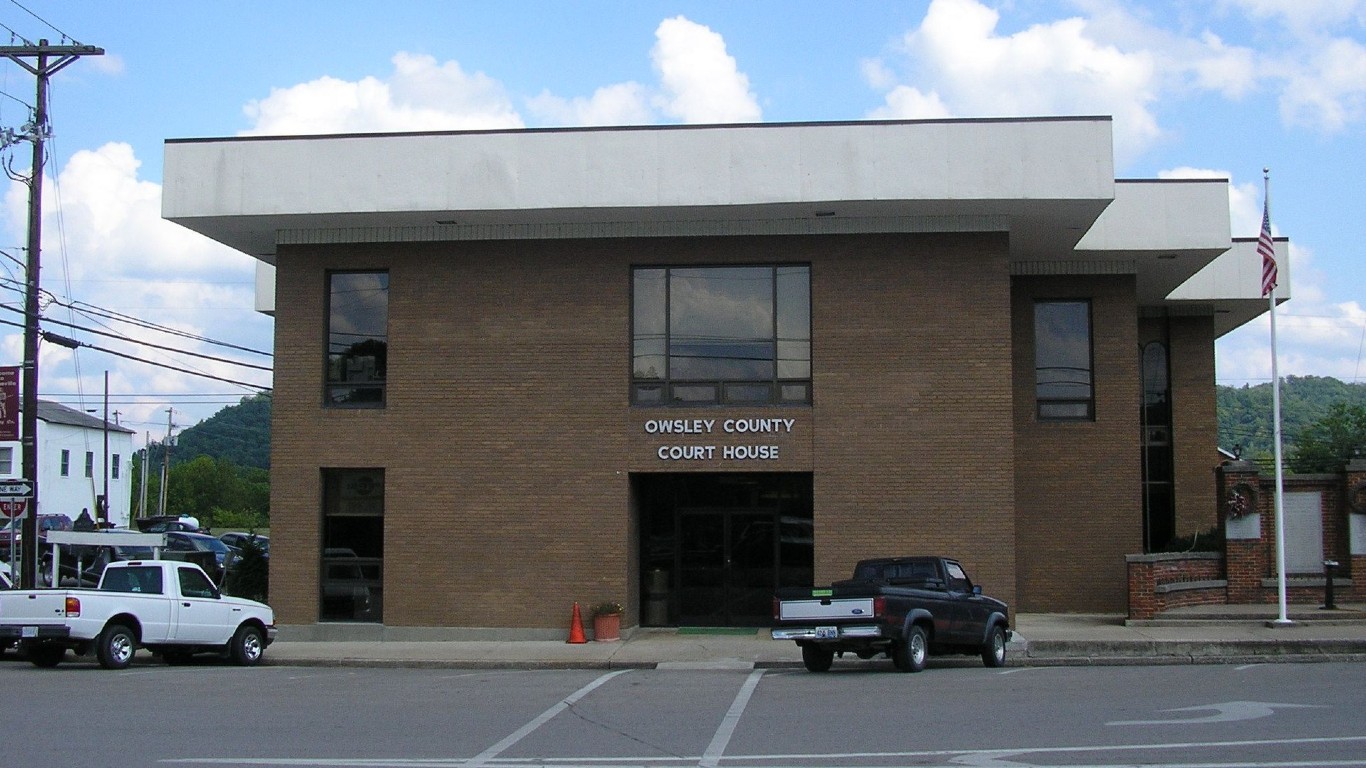
12. Owsley County, Kentucky
> Opioid dispensation rate (2020): 192.2 prescriptions per 100 residents
> Drug overdose rate (opioid and non-opioid, 2018-2021): 69.9 deaths per 100,000 residents (#32 of 3,143 counties)
> Poverty rate: 27.7% (#97 of 3,143 counties)
> Population: 4,094 (#2,875 of 3,143 counties)

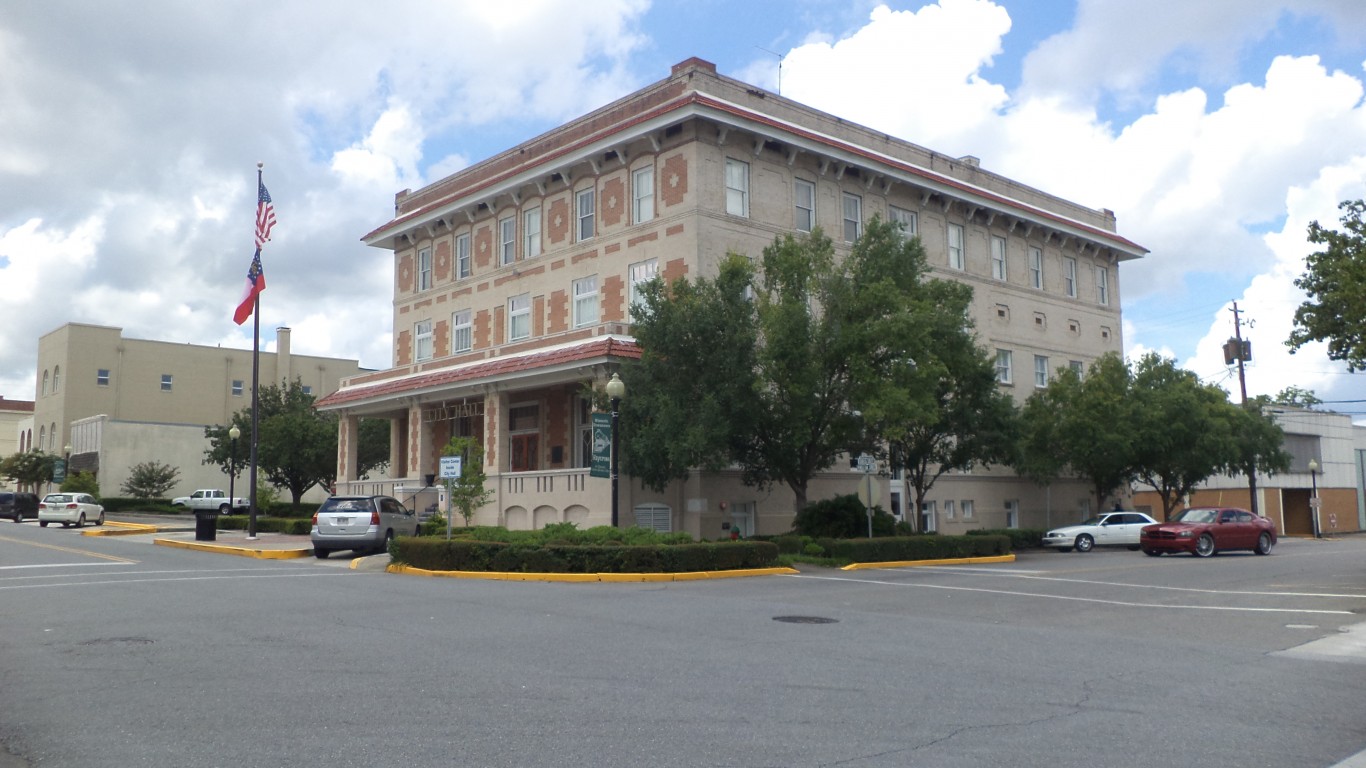
11. Forrest County, Mississippi
> Opioid dispensation rate (2020): 193.8 prescriptions per 100 residents
> Drug overdose rate (opioid and non-opioid, 2018-2021): 18.8 deaths per 100,000 residents (#1,238 of 3,143 counties)
> Poverty rate: 23.0% (#269 of 3,143 counties)
> Population: 77,743 (#723 of 3,143 counties)

10. Harper County, Oklahoma
> Opioid dispensation rate (2020): 205.1 prescriptions per 100 residents
> Drug overdose rate (opioid and non-opioid, 2018-2021): N/A
> Poverty rate: 15.3% (#1,155 of 3,143 counties)
> Population: 3,358 (#2,931 of 3,143 counties)

9. Winchester city, Virginia
> Opioid dispensation rate (2020): 219.0 prescriptions per 100 residents
> Drug overdose rate (opioid and non-opioid, 2018-2021): 33.0 deaths per 100,000 residents (#449 of 3,143 counties)
> Poverty rate: 13.3% (#1,586 of 3,143 counties)
> Population: 28,194 (#1,486 of 3,143 counties)

8. Fredericksburg city, Virginia
> Opioid dispensation rate (2020): 220.4 prescriptions per 100 residents
> Drug overdose rate (opioid and non-opioid, 2018-2021): 41.4 deaths per 100,000 residents (#251 of 3,143 counties)
> Poverty rate: 14.3% (#1,354 of 3,143 counties)
> Population: 28,027 (#1,496 of 3,143 counties)

7. Union County, South Dakota
> Opioid dispensation rate (2020): 233.8 prescriptions per 100 residents
> Drug overdose rate (opioid and non-opioid, 2018-2021): N/A
> Poverty rate: 7.6% (#2,787 of 3,143 counties)
> Population: 16,424 (#2,005 of 3,143 counties)

6. McCracken County, Kentucky
> Opioid dispensation rate (2020): 244.4 prescriptions per 100 residents
> Drug overdose rate (opioid and non-opioid, 2018-2021): 18.6 deaths per 100,000 residents (#1,252 of 3,143 counties)
> Poverty rate: 15.1% (#1,208 of 3,143 counties)
> Population: 67,394 (#793 of 3,143 counties)

5. Montour County, Pennsylvania
> Opioid dispensation rate (2020): 260.7 prescriptions per 100 residents
> Drug overdose rate (opioid and non-opioid, 2018-2021): 19.3 deaths per 100,000 residents (#1,199 of 3,143 counties)
> Poverty rate: 8.7% (#2,617 of 3,143 counties)
> Population: 18,198 (#1,907 of 3,143 counties)
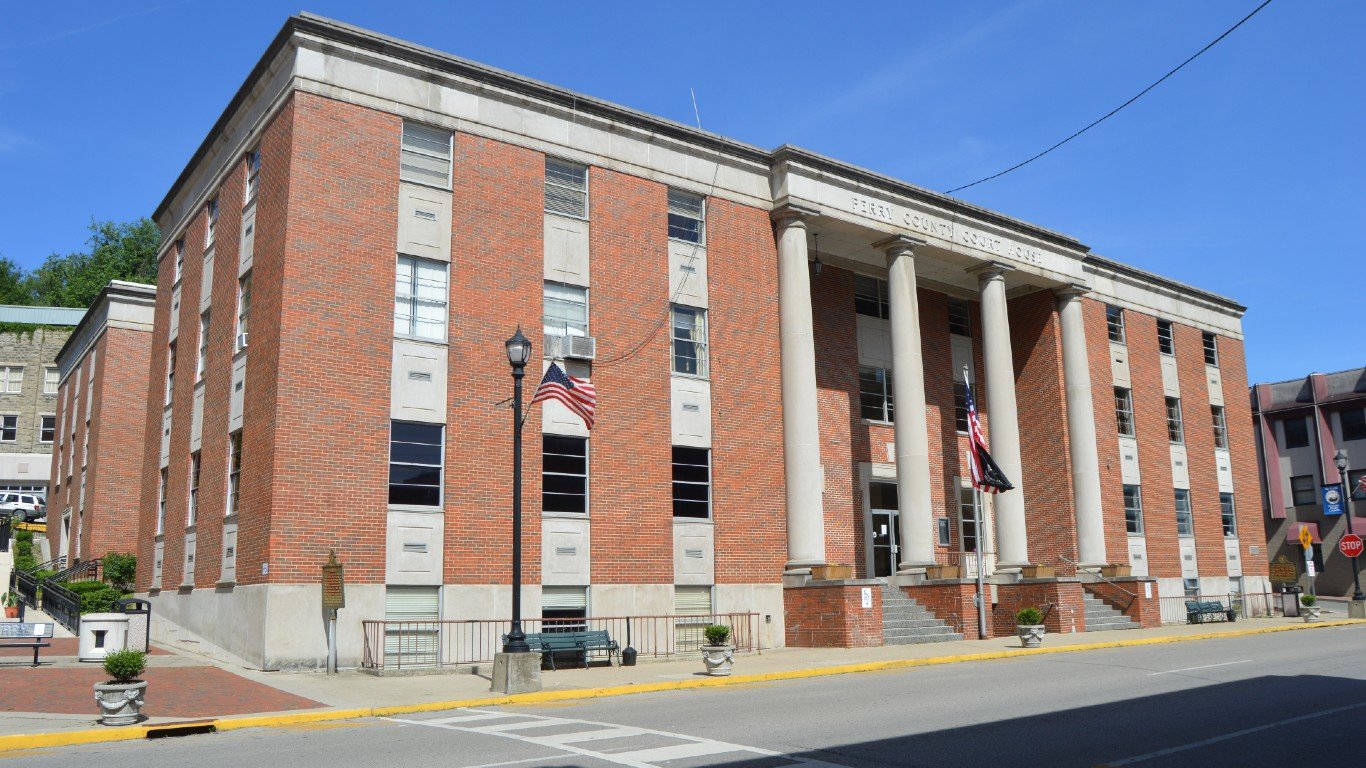
4. Perry County, Kentucky
> Opioid dispensation rate (2020): 316.5 prescriptions per 100 residents
> Drug overdose rate (opioid and non-opioid, 2018-2021): 65.6 deaths per 100,000 residents (#43 of 3,143 counties)
> Poverty rate: 21.5% (#366 of 3,143 counties)
> Population: 28,421 (#1,476 of 3,143 counties)

3. Martinsville city, Virginia
> Opioid dispensation rate (2020): 343.7 prescriptions per 100 residents
> Drug overdose rate (opioid and non-opioid, 2018-2021): 50.7 deaths per 100,000 residents (#119 of 3,143 counties)
> Poverty rate: 25.4% (#167 of 3,143 counties)
> Population: 13,476 (#2,187 of 3,143 counties)

2. Salem city, Virginia
> Opioid dispensation rate (2020): 375.6 prescriptions per 100 residents
> Drug overdose rate (opioid and non-opioid, 2018-2021): 35.4 deaths per 100,000 residents (#370 of 3,143 counties)
> Poverty rate: 10.0% (#2,358 of 3,143 counties)
> Population: 25,335 (#1,586 of 3,143 counties)

1. Norton city, Virginia
> Opioid dispensation rate (2020): 406.7 prescriptions per 100 residents
> Drug overdose rate (opioid and non-opioid, 2018-2021): N/A
> Poverty rate: 28.3% (#85 of 3,143 counties)
> Population: 3,696 (#2,902 of 3,143 counties)