
It’s the end of January and travel enthusiasts are probably already planning their next big trip abroad. But where to? While Europe and Asia are still hot spots, some of the countries that people are crazy about have changed.
As global travel becomes easier and a burgeoning middle class in countries like China boosts travel to nations around the world, international tourism continues to grow. Popular tourist destinations, such as France and the United States, which are among the happiest countries in the world, still hold top spots among visitors, but countries like Spain are catching up.
Security concerns and political unrest have negatively impacted tourism at some popular hotspots in recent years — the U.S. government doesn’t even want you to go to certain places — but countries such as Russia and Turkey are bouncing back.
Negative media attention hasn’t deterred Americans from places like Mexico or Russia, but seems to be impacting visitors coming to the United States. Growth is slowing down as of 2017. Reports have predicted more drops and put the blame on President Donald Trump’s policies and rhetoric.
In order to determine the most visited countries in the world, 24/7 Wall St. analyzed data on international tourism and number of arrivals in 264 countries between 1995 and 2016 provided by the World Bank. The number of international arrivals in 2016 was used to determine the most visited destinations. Data on population composition and 2016 tourism revenue comes from the World Bank, and Gross Domestic Product for 2017 from the International Monetary Fund (IMF).

25. Ukraine
> Number of arrivals, 2016: 13,333,000
> Annual average change in tourists arrivals, 2011-2016: -1,616,400
> Population, 2017: 44,831,159
> Tourism revenue, % of GDP: 3.7%
> GDP per capita: $7,894
Lonely Planet describes Ukraine as “big, diverse and largely undiscovered,” and “one of Europe’s last genuine travel frontiers, a nation rich in colorful tradition, warm-hearted people and off-the-map experiences.” CNN recently named Ukraine a top destination to visit, but the former Soviet republic suffered a decline in tourists starting in 2014 following Russia’s land-grab of the Crimea Peninsula and the unrest that followed.
The ongoing land dispute and security concerns led to 10 million fewer visitors between 2013 and 2017, with the bulk of the remaining tourists coming from Eastern Europe, as well as neighboring Turkey and Western Europe. After bottoming at about 2 million visitors in 2015, numbers increased in the following two years, but with the ongoing Crimea crisis, the recovery of Ukraine’s tourism industry is still in peril.

24. Croatia
> Number of arrivals, 2016: 13,809,000
> Annual average change in tourists arrivals, 2011-2016: 776,400
> Population, 2017: 4,125,700
> Tourism revenue, % of GDP: 38.8%
> GDP per capita: $22,670
Croatia may not have the name recognition as some of its more famous western European neighbors, but this small European nation has a lot to offer tourists â including several UNESCO World Heritage Sites and a scenic Adriatic coast. Croatia has only been an independent nation for 27 years, but since then has been growing in popularity, especially among European Union visitors.
The 2008 global financial crisis led to a downturn in tourism. But inclusion in the European Union, favorable travel trends and its role as a major “Game of Thrones” filming location have boosted Croatia’s visitors and travel profile.

23. India
> Number of arrivals, 2016: 14,569,000
> Annual average change in tourists arrivals, 2011-2016: 1,652,000
> Population, 2017: 1,339,180,127
> Tourism revenue, % of GDP: 5.4%
> GDP per capita: $6,427
India’s tourism appeal needs little explanation, with millions of visitors coming from the East and West each year. Neighboring Bangladesh is responsible for the top number of arrivals, followed by the United States, U.K. and Canada. The implementation of an e-Tourist Visa in 2014 has contributed to tourism growth, as the industry becomes a more important part of the country’s economy and job sector.
Beyond leisure trips, medical and sports tourism are contributing to the boost in visitors. India hopes to increase tourism through sports like golf and polo, and the country is experiencing a 22% to 25% growth in medical tourism, with a projected income of $8 billion for 2020.

22. Macao SAR, China
> Number of arrivals, 2016: 15,703,600
> Annual average change in tourists arrivals, 2011-2016: 555,720
> Population, 2017: 622,567
> Tourism revenue, % of GDP: 88.7%
> GDP per capita: $104,862
A special administrative district (SAR) located to the southeast of mainland China, Macao receives most of its revenue from tourism. Until 1999 Macao was a Portuguese territory and is still known for its blend of Chinese and Portuguese cultures, as well as gambling. Mainland China, Hong Kong, Taiwan, South Korea, and Japan make up its top foreign visitors.

21. Netherlands
> Number of arrivals, 2016: 15,828,000
> Annual average change in tourists arrivals, 2011-2016: 905,600
> Population, 2017: 17,132,854
> Tourism revenue, % of GDP: 2.9%
> GDP per capita: $48,473
Known for its canals, windmills and tulip fields, the Netherlands attracts most visitors from near, rather than far. The majority of its tourists come from Europe, particularly neighboring nations. Germans are the most fond of the bike-loving country, followed by Belgians and British. Outside of Europe, the U.S., China and Canada make up the majority of foreign visitors.

20. South Korea
> Number of arrivals, 2016: 17,242,000
> Annual average change in tourists arrivals, 2011-2016: 1,489,400
> Population, 2017: 51,466,201
> Tourism revenue, % of GDP: 3.5%
> GDP per capita: $35,938
In 2010, South Korea started campaigning to attract more foreign visitors and travelers beyond the business sector. The Asian nation was also looking to expand its reach beyond domestic tourism, which makes up the majority of the tourism market, and nearby East Pacific countries. The Korea Tourism Organization even targeted 100,000 arrivals from India in 2013. Japan, China and Taiwan, however, still make up the top share of visitors, followed by the U.S.

19. Poland
> Number of arrivals, 2016: 17,471,000
> Annual average change in tourists arrivals, 2011-2016: 824,200
> Population, 2017: 37,975,841
> Tourism revenue, % of GDP: 4.9%
> GDP per capita: $27,216
Facing the challenges of post-war recovery and communist rule, Poland has emerged as a rising tourist destination in the 21st century. Joining the European Union in 2004 further fueled its tourism industry, which offers thousands of years of history and architecture, along with unspoiled nature. Most of its visitors come from Germany, with 6.5 million Germans visiting in 2017. Tourists from Ukraine were next (1.4 million), followed by Russia (876,000) and Great Britain (851,000).

18. Saudi Arabia
> Number of arrivals, 2016: 18,049,000
> Annual average change in tourists arrivals, 2011-2016: 774,000
> Population, 2017: 32,938,213
> Tourism revenue, % of GDP: 6.0%
> GDP per capita: $49,045
As of June 2017 Saudi Arabia issued 6.75 million religious pilgrim visas. But the kingdom is targeting more diverse tourists, including from the West, as part of a plan by Crown Prince Mohammed Bin Salman’s to attract 30 million visitors by 2030 and move away from the country’s dependence on oil. This effort has included issuing visas, which began last year for sports events and concerts.

17. Canada
> Number of arrivals, 2016: 19,824,000
> Annual average change in tourists arrivals, 2011-2016: 762,000
> Population, 2017: 36,708,083
> Tourism revenue, % of GDP: 3.8%
> GDP per capita: $44,018
Historically U.S. tourists have made up the majority of Canada’s foreign tourist market. But for several years that market share shrank as tourism from other countries increased. In 2017, however, travel from the U.S. rebounded, climbing 3.1 percent, the highest figure since 2005, according to Statistics Canada. International tourism also set an annual record that year, with 20.8 million trips of at least one night.
Overseas travellers to Canada have predominantly come from Europe, particularly from the U.K., followed by Germany and France. But in recent decades, growth in the number of Chinese tourists has averaged 12.3% per year, and they’ve now become the second-largest source of overseas travelers.

> Number of arrivals, 2016: 24,040,000
> Annual average change in tourists arrivals, 2011-2016: 3,564,200
> Population, 2017: 126,785,797
> Tourism revenue, % of GDP: 4.1%
> GDP per capita: $39,002
Chinese tourists to Japan nearly doubled from 2014 to 2015, reaching 5 million, edging out South Korea as the nation’s top foreign visitors, according to the Japan National Tourism Organization. The country’s tourism previously dipped after the Fukushima nuclear disaster in March 2011, and to boost tourism the Japanese Tourism Agency gave away 10,000 round-trip air tickets to the country. Easing of visa restrictions for the Chinese and other nations, along with overall global travel trends, ultimately helped the country turn around from the disaster. Today, Japan is trying to deal with the inevitable headaches of swelling tourism that come with economic booms.

15. Russia
> Number of arrivals, 2016: 24,571,000
> Annual average change in tourists arrivals, 2011-2016: -72,200
> Population, 2017: 144,495,044
> Tourism revenue, % of GDP: 3.9%
> GDP per capita: $24,766
Russian tourism has continued to rise following the fall of the Soviet Union in 1991. Top foreign visitors come from Ukraine, Kazakhstan, Uzbekistan and China. Russia’s military aggression against Ukraine in 2014 contributed to a temporary drop in its annual average change in tourists, but tourism is currently booming, with significant increases from Southeast Asia and Latin America. U.S. visitors have also increased to record numbers in recent years, despite politics between the two countries. The saying “there is no such thing as bad publicity” rings true, as Russia’s constant place in American headlines has piqued interest in travel to the country, according to tourism experts.

14. Greece
> Number of arrivals, 2016: 24,799,000
> Annual average change in tourists arrivals, 2011-2016: 1,674,400
> Population, 2017: 10,760,421
> Tourism revenue, % of GDP: 30.1%
> GDP per capita: $24,574
Despite three economic bailouts since 2010, Greece’s tourism has suffered little and continues to show strong growth. It’s a significant contributor to the country’s economy, at 30% of the GDP. Tourism revenues rose by nearly $2.3 billion in 2018 â the fourth consecutive year of growth âaccording to the country’s tourism minister. Chinese visitors to Greece, who are fueling a worldwide global boom in travel, are estimated to increase in 2019. They seek it out for for weddings, honeymoons, and for luxury and culture tourism, according to the Greek National Tourism Organization.

13. Hong Kong SAR, China
> Number of arrivals, 2016: 26,553,000
> Annual average change in tourists arrivals, 2011-2016: 847,400
> Population, 2017: 7,391,700
> Tourism revenue, % of GDP: 6.3%
> GDP per capita: $56,055
The Individual Visit Scheme, enacted in 2003, eased travel from Mainland China to Hong Kong and fellow special administrative district (SAR) Macao. Previously, Mainland residents could only visit either SAR on business visas or as part of a tour. Today, Mainland China makes up the largest number of tourist arrivals, followed by Taiwan, South Korea, Japan and the U.S. Recent tense relations between the Mainland and Hong Kong resulted in a dip in visitor numbers, but this trend appears to have faded.

12. Malaysia
> Number of arrivals, 2016: 26,757,000
> Annual average change in tourists arrivals, 2011-2016: 408,600
> Population, 2017: 31,624,264
> Tourism revenue, % of GDP: 9.0%
> GDP per capita: $26,808
In 1999 Malaysia launched the “Malaysia Truly Asia” campaign to promote tourism worldwide. It successfully helped increase tourist arrivals from 10.2 million in 2000 to 25.9 million in 2017. Tourism has also significantly contributed to the country’s economic growth, climbing to a share of 14.9% in 2017, from 10.4% in 2005. Even though the number of tourists dropped by 3% in 2017 from the previous year, Malaysia was the second most-visited Southeast Asian country after Thailand, according to the ministry of tourism. The East Asian tourism market increased by 6.3%, while other markets saw a decline. Top tourist countries for Malaysia are Singapore, Indonesia, China, and Thailand.

11. Austria
> Number of arrivals, 2016: 28,121,000
> Annual average change in tourists arrivals, 2011-2016: 1,021,800
> Population, 2017: 8,809,212
> Tourism revenue, % of GDP: 9.4%
> GDP per capita: $45,437
Austria has continued to experience a booming tourism industry in recent years due to favorable economic conditions, new marketing campaigns and an increase in travelers from Southeast Asia. The majority of tourists come from from Germany and the Netherlands. Visitors from Southeast Asia increased by 35 % in 2017. Most vacationers prefer Tyrol, but Vienna is still very popular. Tyrol and Salzburg make up more than half of all overnight stays in 2017.

10. Turkey
> Number of arrivals, 2016: 30,289,000
> Annual average change in tourists arrivals, 2011-2016: -873,000
> Population, 2017: 80,745,020
> Tourism revenue, % of GDP: 14.2%
> GDP per capita: $25,129
A series of terrorist attacks and a failed 2016 coup caused a drop in Turkey’s tourism. The decline was particularly impacted by a drop in Russian tourists, causing the number of foreign arrivals to fall to 25.3 million in 2016 from 36.2 million the previous year. Recently, however, Russian visitors have returned due, in part, to the normalizing of the countries’ relations after Turkey’s downing of a Russian warplane in 2015. Russia was Turkey’s top tourist market in 2017, followed by Germany, which has a large Turkish diaspora, and Iran.

9. Thailand
> Number of arrivals, 2016: 32,530,000
> Annual average change in tourists arrivals, 2011-2016: 2,660,000
> Population, 2017: 69,037,513
> Tourism revenue, % of GDP: 18.6%
> GDP per capita: $16,278
Thailand is a popular tourist destination worldwide for its cultural and natural beauty, and even has a growing medical tourism industry. Though political unrest threatened the sector in 2014, and so did a crackdown on inflated Chinese tours a couple years later, tourism revenue remains strong, making up 18.6% of the GDP. The number of international visitors was up 8.8% in 2017 to a record 35.4 million. Chinese visitors were the biggest contributors, but Europeans spend a lot as well.

8. Mexico
> Number of arrivals, 2016: 35,079,000
> Annual average change in tourists arrivals, 2011-2016: 2,335,200
> Population, 2017: 129,163,276
> Tourism revenue, % of GDP: 5.2%
> GDP per capita: $17,336
Mexico continues to be a top tourist destination and is the most popular foreign hotspot among Americans. Canada and the U.K. follow the U.S. in most arrivals. About 20.6 million visitors from these three countries traveled to Mexico through the first six months of 2018, according to the country’s Ministry of Tourism. Despite Mexico’s issues with violence and crime, tourism numbers continue to climb, showing a 7.3 percent increase when compared to the first six months of 2017 â with cruise ship arrivals and spending also up.

7. Germany
> Number of arrivals, 2016: 35,555,000
> Annual average change in tourists arrivals, 2011-2016: 1,436,200
> Population, 2017: 82,695,000
> Tourism revenue, % of GDP: 3.2%
> GDP per capita: $45,229
While Germany falls behind other popular European destinations like Spain and France â and doesn’t need to rely on tourism because of its strong economy â the country continues to have a thriving tourism industry. A positive image, rich culture and central European location contribute to its tourism success. Top foreign visitors include the Netherlands, Switzerland, United States, U.K., and Austria.
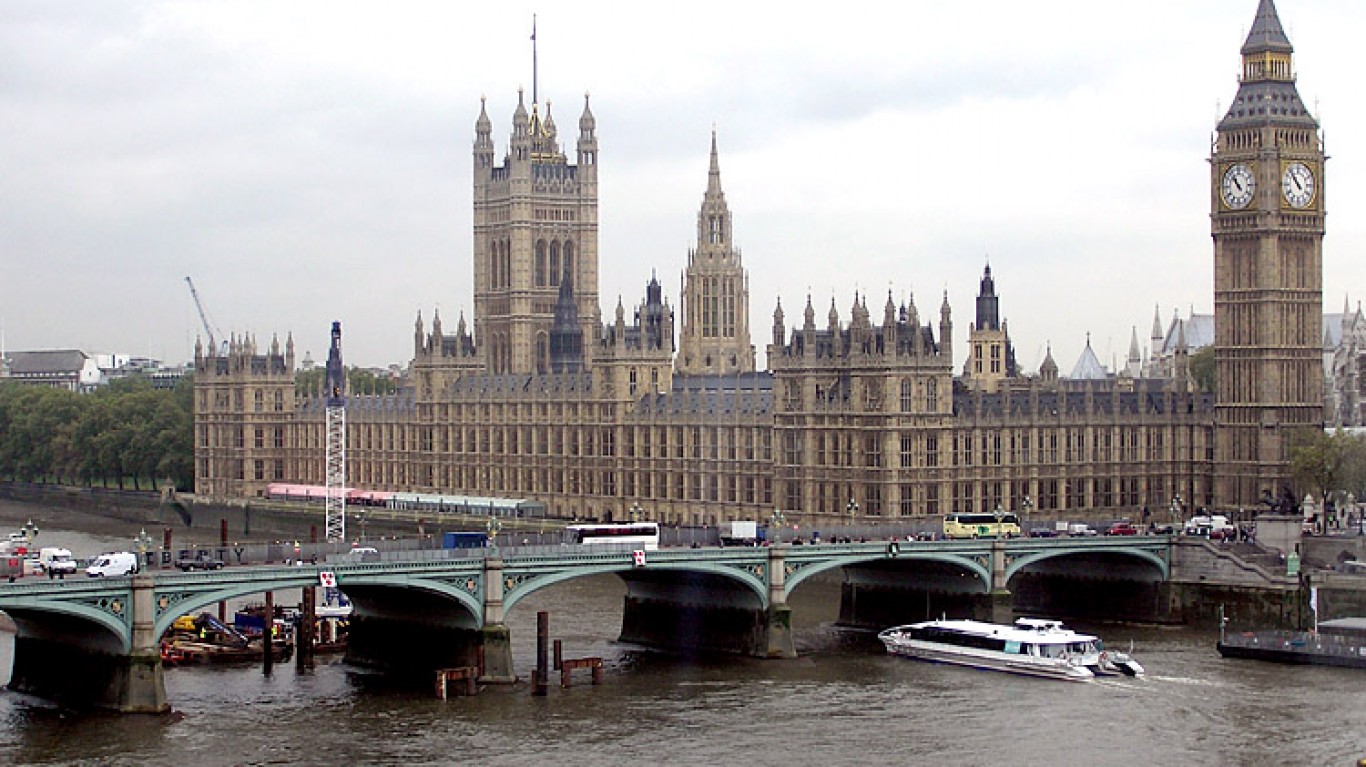
6. United Kingdom
> Number of arrivals, 2016: 35,814,000
> Annual average change in tourists arrivals, 2011-2016: 1,301,600
> Population, 2017: 66,022,273
> Tourism revenue, % of GDP: 7.4%
> GDP per capita: $39,753
Europe and America contributes to most of the U.K’s foreign visitors, with France, the United States, and Germany as the top visiting countries. Fears over Brexit’s impact on tourism have been overridden by a drop in the pound against the euro and the dollar. The exchange rate is helping to fuel record numbers of tourists.

5. Italy
> Number of arrivals, 2016: 52,372,000
> Annual average change in tourists arrivals, 2011-2016: 1,250,600
> Population, 2017: 60,551,416
> Tourism revenue, % of GDP: 7.3%
> GDP per capita: $35,220
Food, art, history, and fashion are just a few of the reasons to visit Italy and why tourism to this European destination continues to boom. Figures from 2017 show another record year with more than 420 million visitors in 2017. The majority of tourists come from Germany, followed by France, the U.K., and the United States. Like some other popular hotspots, Italy is both benefiting and hurting from the crowds. Tourists are overcrowding Venice, Capri is suffering from an influx of ferries, and even Florence and Rome are trying to regulate the increase in tourism.
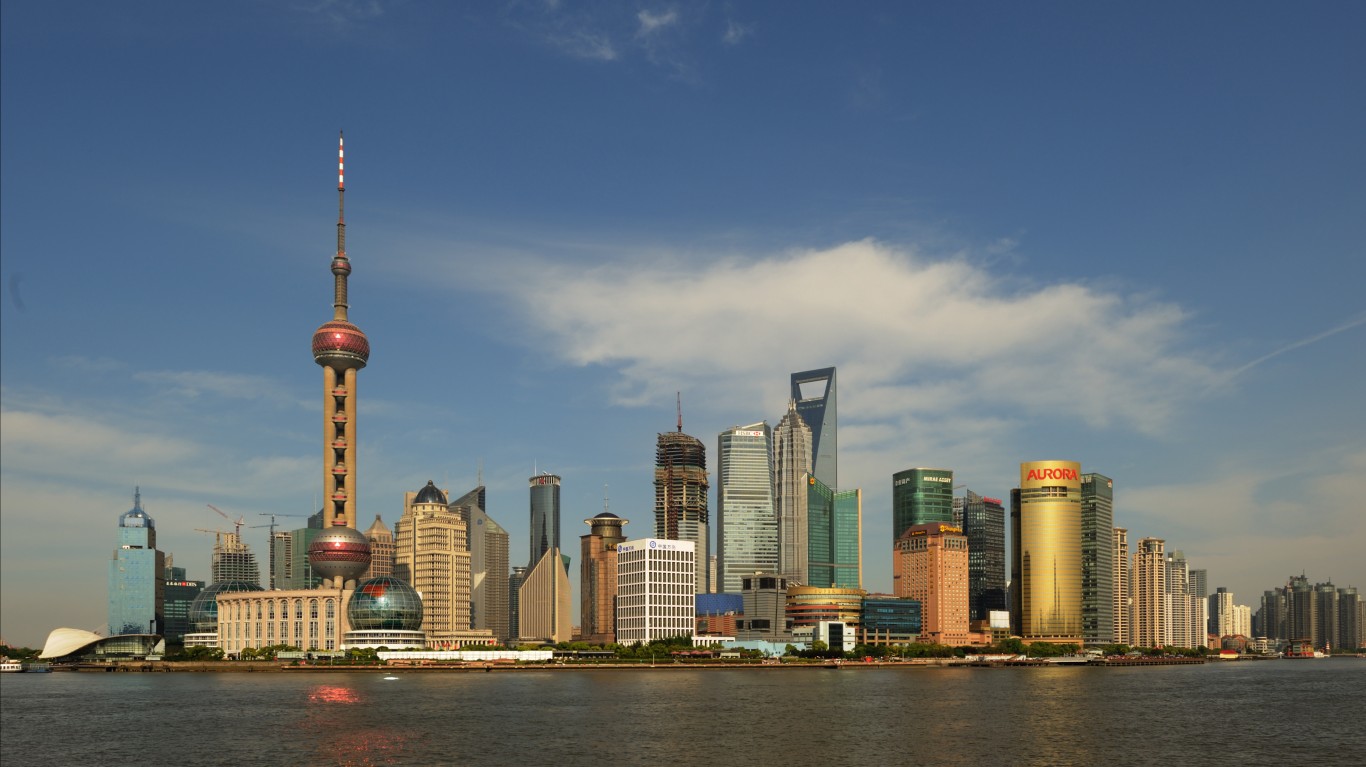
4. China
> Number of arrivals, 2016: 59,270,000
> Annual average change in tourists arrivals, 2011-2016: 337,800
> Population, 2017: 1,386,395,000
> Tourism revenue, % of GDP: 2.0%
> GDP per capita: $15,309
As a growing middle class in China contributes to tourism growth both domestically and abroad, foreign tourists are also flocking to the country in large numbers. Asian tourists from outside China and its special administrative regions are increasing in numbers as intra-Asia travel in general has been growing due to people having more disposable income. The most international tourists are from South Korea, followed Japan, Russia, Vietnam, Malaysia, and Mongolia.

3. Spain
> Number of arrivals, 2016: 75,315,000
> Annual average change in tourists arrivals, 2011-2016: 3,827,600
> Population, 2017: 46,572,028
> Tourism revenue, % of GDP: 14.9%
> GDP per capita: $34,272
Although sometimes overshadowed by its neighbor and world tourism leader, France, Spain has found its way into the spotlight with booming visitor growth. The country saw a 3.8 million average annual increase in visitors from 2011 to 2016, outpacing all other nations during that period. With destination cities like Madrid and Barcelona, and attractions from food, art and museums to nightlife, beaches and mountains, most of its travelers come from Europe, followed by the United States.

2. United States
> Number of arrivals, 2016: 75,608,000
> Annual average change in tourists arrivals, 2011-2016: 2,557,400
> Population, 2017: 325,719,178
> Tourism revenue, % of GDP: 11.1%
> GDP per capita: $54,225
The travel industry has such a large impact on the U.S,. economy that the U.S. Travel Association estimates each household would pay $1,300 more in taxes without the revenue generated by travel and tourism. According to the organization, overseas visits account for half of all international visits to the U.S., with the other half originating from Canada and Mexico. The United Kingdom, China and Japan top the list of overseas visitors.

1. France
> Number of arrivals, 2016: 82,570,000
> Annual average change in tourists arrivals, 2011-2016: 414,200
> Population, 2017: 67,118,648
> Tourism revenue, % of GDP: 6.9%
> GDP per capita: $38,606
It’s no surprise that France tops the list of the world’s most visited countries. Films, museums,TV shows, food, and fashion have made Paris the ultimate bucket list destination. The romance capital of the world beat out the much larger United States in visits, even though its annual average growth of number of international tourists is not as large. Spain also came up short by several million in visitors to France, but beats its neighbor by more than 3 million during the same five-year growth period. Following the November 2015 Paris Terrorist Attacks, the country experienced a downward tourist trend ââ something it hadn’t seen in over a decade. But France has quickly recovered, experiencing record hotel visits in 2017, and new problems of how to handle too many tourists.