
Life expectancy is one of the most important and commonly cited indicators of population health — and in the United States, life expectancy is falling at a historic rate. According to the Centers for Disease Control and Prevention, life expectancy at birth declined by 1.5 years in 2020, the largest one-year drop since World War II.
The CDC attributes the decline to the COVID-19 pandemic and 93,000 drug overdose deaths — an all-time one-year high. Homicide, diabetes, and liver disease were also contributing factors. Here is a look at the states with the most drug overdose deaths in 2020.
Even before the pandemic, there were parts of the country where life expectancy at birth was far lower than the national average — in some cases by five years or more.
Using data from County Health Rankings & Roadmaps, a Robert Wood Johnson Foundation and University of Wisconsin Population Health Institute joint program, 24/7 Tempo identified the 50 U.S. metro areas with the shortest average life expectancy at birth. Life expectancy figures are averages for the years 2017 through 2019, the most recent period for which metro-level data is available.
Among the metro areas on this list, average life expectancy at birth ranges from 75.9 years down to less than 73 years — compared to the national average of 79.2 years. The vast majority of the metro areas on this list are located in the South, including seven in Alabama alone.
Variations in life expectancy are tied to a number of both economic and behavioral factors. For example, tobacco use is the leading cause of preventable death in the U.S., and in every metro area on this list, the share of adults who smoke is above the 16.6% national average. Here is a look at the American cities where the most people smoke.
Income levels are also linked to life expectancy. Poverty, for example, presents challenges and stressors that can take a cumulative toll on both physical and mental health. Additionally, lower-income Americans are less able to afford adequate health care or a range of healthy options related to diet and lifestyle. Recent studies have shown that life expectancy among the wealthiest 1% of Americans exceeds that of the poorest 1% by well over a decade. In all but a few metro areas on this list, the poverty rate exceeds the 12.3% national average.

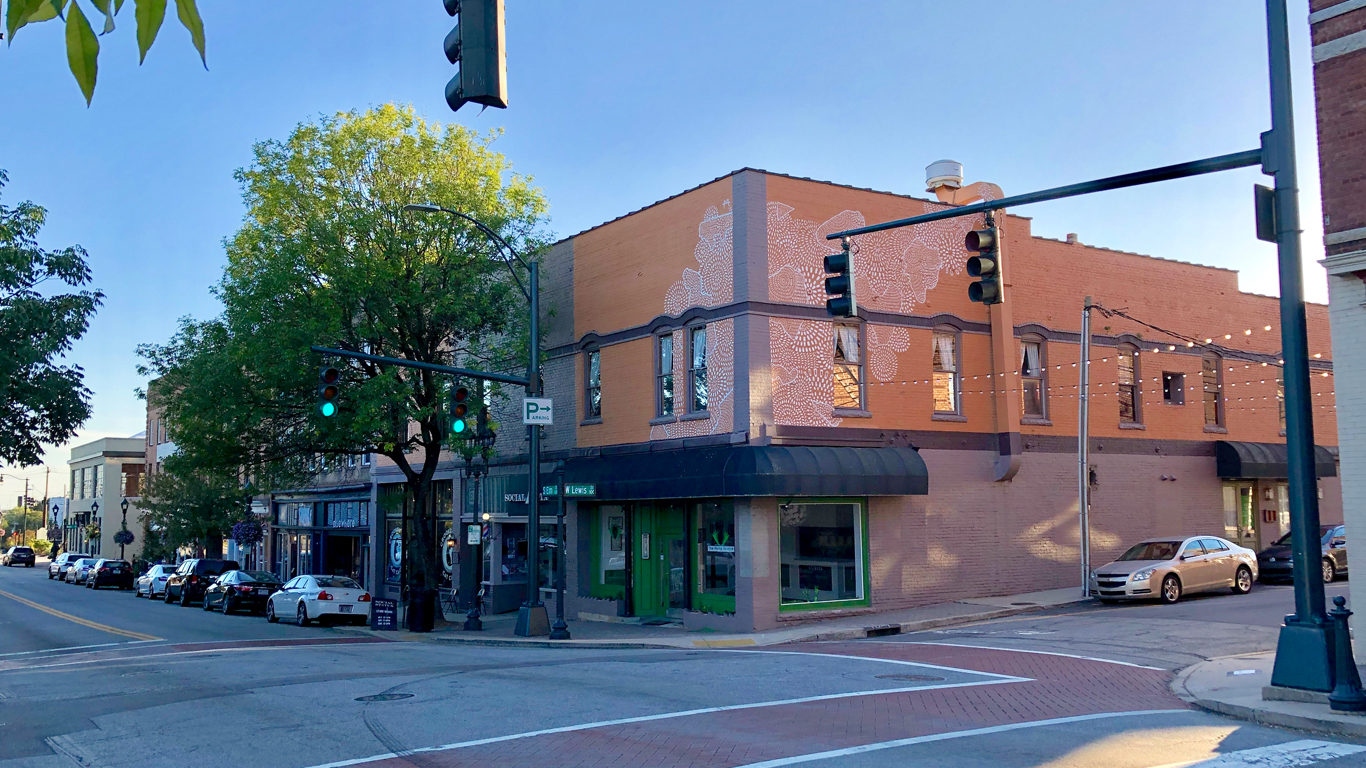
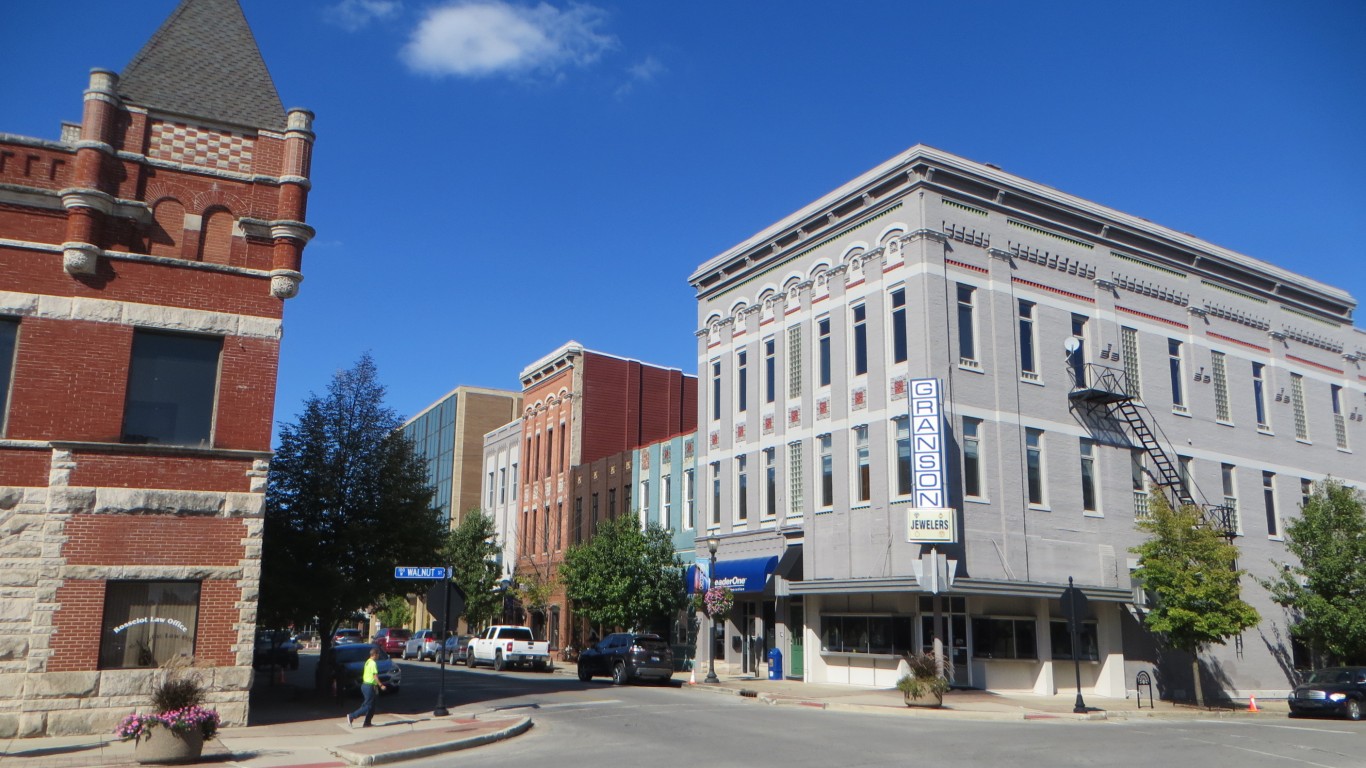
50. Terre Haute, IN
> Life expectancy at birth (years): 75.9
> Adults reporting poor or fair health: 20.0% — 128th highest of 384 metros
> Adult obesity rate: 34.7% — 111th highest of 384 metros
> Smoking rate: 25.0% — 14th highest of 384 metros
> Population without health insurance: 6.9% — 142nd lowest of 384 metros
> Median household income: $50,129 — 60th lowest of 384 metros
> Poverty rate: 18.0% — 46th highest of 384 metros

49. Florence-Muscle Shoals, AL
> Life expectancy at birth (years): 75.9
> Adults reporting poor or fair health: 20.9% — 95th highest of 384 metros
> Adult obesity rate: 34.0% — 128th highest of 384 metros
> Smoking rate: 20.8% — 111th highest of 384 metros
> Population without health insurance: 10.5% — 119th highest of 384 metros
> Median household income: $45,824 — 17th lowest of 384 metros
> Poverty rate: 15.8% — 91st highest of 384 metros
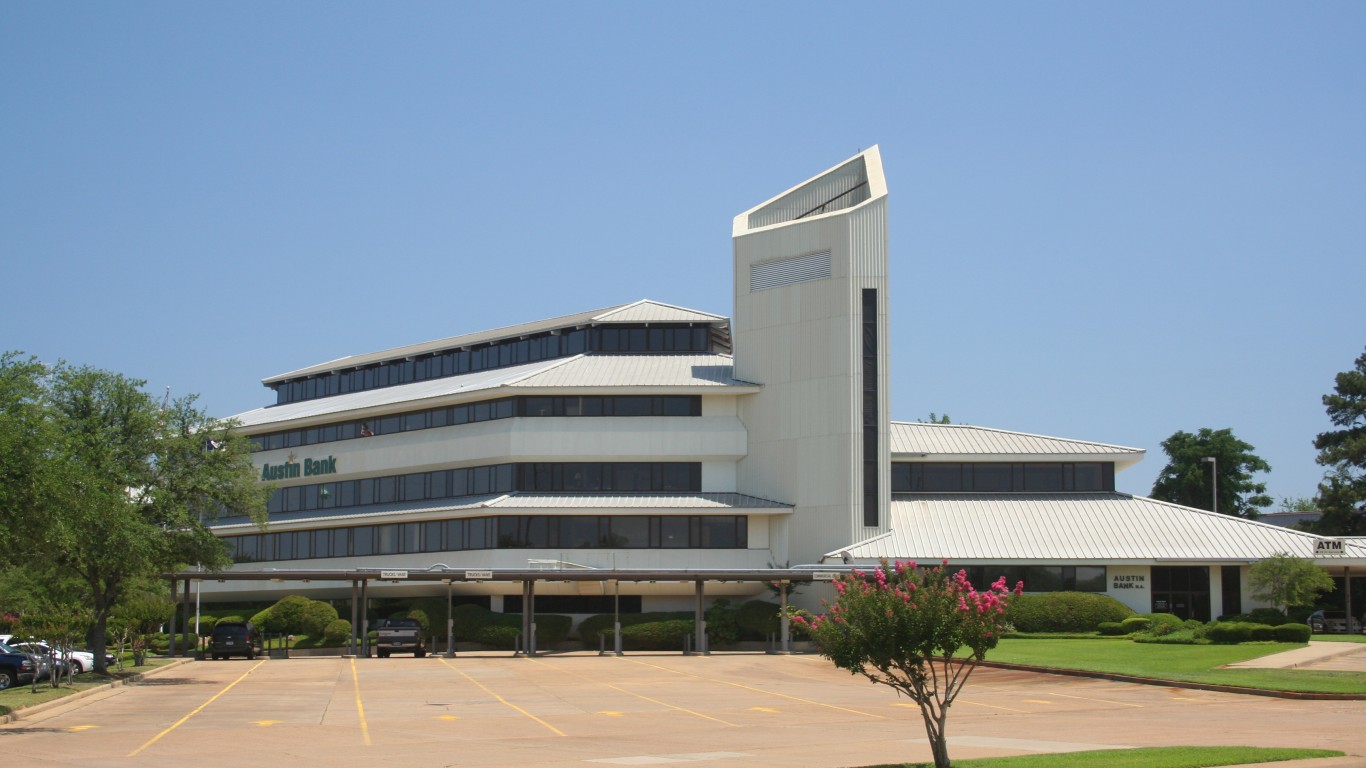
48. Longview, TX
> Life expectancy at birth (years): 75.8
> Adults reporting poor or fair health: 22.2% — 59th highest of 384 metros
> Adult obesity rate: 35.2% — 94th highest of 384 metros
> Smoking rate: 20.3% — 137th highest of 384 metros
> Population without health insurance: 16.6% — 17th highest of 384 metros
> Median household income: $55,970 — 137th lowest of 384 metros
> Poverty rate: 17.7% — 55th highest of 384 metros

47. Beaumont-Port Arthur, TX
> Life expectancy at birth (years): 75.8
> Adults reporting poor or fair health: 22.2% — 56th highest of 384 metros
> Adult obesity rate: 41.5% — 5th highest of 384 metros
> Smoking rate: 20.7% — 114th highest of 384 metros
> Population without health insurance: 18.2% — 10th highest of 384 metros
> Median household income: $58,818 — 186th lowest of 384 metros
> Poverty rate: 15.0% — 119th highest of 384 metros
46. Goldsboro, NC
> Life expectancy at birth (years): 75.8
> Adults reporting poor or fair health: 23.6% — 30th highest of 384 metros
> Adult obesity rate: 39.7% — 13th highest of 384 metros
> Smoking rate: 22.1% — 62nd highest of 384 metros
> Population without health insurance: 12.7% — 55th highest of 384 metros
> Median household income: $44,596 — 11th lowest of 384 metros
> Poverty rate: 19.4% — 29th highest of 384 metros

45. Wichita Falls, TX
> Life expectancy at birth (years): 75.8
> Adults reporting poor or fair health: 21.8% — 71st highest of 384 metros
> Adult obesity rate: 35.2% — 92nd highest of 384 metros
> Smoking rate: 19.7% — 163rd highest of 384 metros
> Population without health insurance: 15.3% — 22nd highest of 384 metros
> Median household income: $52,233 — 91st lowest of 384 metros
> Poverty rate: 13.1% — 180th highest of 384 metros

44. Spartanburg, SC
> Life expectancy at birth (years): 75.8
> Adults reporting poor or fair health: 18.9% — 177th highest of 384 metros
> Adult obesity rate: 35.5% — 86th highest of 384 metros
> Smoking rate: 19.8% — 159th highest of 384 metros
> Population without health insurance: 9.7% — 141st highest of 384 metros
> Median household income: $55,339 — 128th lowest of 384 metros
> Poverty rate: 12.8% — 189th lowest of 384 metros

43. Shreveport-Bossier City, LA
> Life expectancy at birth (years): 75.8
> Adults reporting poor or fair health: 23.7% — 27th highest of 384 metros
> Adult obesity rate: 39.7% — 14th highest of 384 metros
> Smoking rate: 22.5% — 57th highest of 384 metros
> Population without health insurance: 9.7% — 140th highest of 384 metros
> Median household income: $47,447 — 24th lowest of 384 metros
> Poverty rate: 22.2% — 12th highest of 384 metros

42. Homosassa Springs, FL
> Life expectancy at birth (years): 75.7
> Adults reporting poor or fair health: 19.8% — 136th highest of 384 metros
> Adult obesity rate: 28.7% — 92nd lowest of 384 metros
> Smoking rate: 23.1% — 39th highest of 384 metros
> Population without health insurance: 11.9% — 80th highest of 384 metros
> Median household income: $50,751 — 72nd lowest of 384 metros
> Poverty rate: 15.7% — 94th highest of 384 metros

41. Kingsport-Bristol, TN-VA
> Life expectancy at birth (years): 75.7
> Adults reporting poor or fair health: 21.8% — 70th highest of 384 metros
> Adult obesity rate: 32.3% — 179th highest of 384 metros
> Smoking rate: 24.9% — 17th highest of 384 metros
> Population without health insurance: 9.7% — 138th highest of 384 metros
> Median household income: $48,615 — 39th lowest of 384 metros
> Poverty rate: 15.5% — 103rd highest of 384 metros

40. Dothan, AL
> Life expectancy at birth (years): 75.7
> Adults reporting poor or fair health: 23.9% — 24th highest of 384 metros
> Adult obesity rate: 38.6% — 27th highest of 384 metros
> Smoking rate: 23.0% — 41st highest of 384 metros
> Population without health insurance: 12.2% — 69th highest of 384 metros
> Median household income: $50,010 — 58th lowest of 384 metros
> Poverty rate: 18.6% — 38th highest of 384 metros

39. Jackson, TN
> Life expectancy at birth (years): 75.6
> Adults reporting poor or fair health: 23.7% — 26th highest of 384 metros
> Adult obesity rate: 40.1% — 9th highest of 384 metros
> Smoking rate: 24.0% — 28th highest of 384 metros
> Population without health insurance: 10.8% — 111th highest of 384 metros
> Median household income: $48,700 — 42nd lowest of 384 metros
> Poverty rate: 16.0% — 85th highest of 384 metros

38. Fort Smith, AR-OK
> Life expectancy at birth (years): 75.6
> Adults reporting poor or fair health: 26.2% — 10th highest of 384 metros
> Adult obesity rate: 36.4% — 69th highest of 384 metros
> Smoking rate: 25.2% — 12th highest of 384 metros
> Population without health insurance: 11.1% — 100th highest of 384 metros
> Median household income: $45,157 — 15th lowest of 384 metros
> Poverty rate: 19.4% — 30th highest of 384 metros

37. Birmingham-Hoover, AL
> Life expectancy at birth (years): 75.6
> Adults reporting poor or fair health: 19.9% — 135th highest of 384 metros
> Adult obesity rate: 35.9% — 79th highest of 384 metros
> Smoking rate: 18.9% — 187th lowest of 384 metros
> Population without health insurance: 8.8% — 166th highest of 384 metros
> Median household income: $58,366 — 180th lowest of 384 metros
> Poverty rate: 14.0% — 145th highest of 384 metros

36. Memphis, TN-MS-AR
> Life expectancy at birth (years): 75.6
> Adults reporting poor or fair health: 22.8% — 44th highest of 384 metros
> Adult obesity rate: 36.3% — 70th highest of 384 metros
> Smoking rate: 21.2% — 92nd highest of 384 metros
> Population without health insurance: 11.2% — 93rd highest of 384 metros
> Median household income: $54,859 — 123rd lowest of 384 metros
> Poverty rate: 15.4% — 110th highest of 384 metros

35. Gulfport-Biloxi, MS
> Life expectancy at birth (years): 75.5
> Adults reporting poor or fair health: 21.3% — 85th highest of 384 metros
> Adult obesity rate: 35.3% — 89th highest of 384 metros
> Smoking rate: 21.2% — 95th highest of 384 metros
> Population without health insurance: 13.1% — 50th highest of 384 metros
> Median household income: $50,642 — 71st lowest of 384 metros
> Poverty rate: 16.4% — 76th highest of 384 metros

34. Clarksville, TN-KY
> Life expectancy at birth (years): 75.5
> Adults reporting poor or fair health: 22.3% — 53rd highest of 384 metros
> Adult obesity rate: 36.3% — 71st highest of 384 metros
> Smoking rate: 22.9% — 43rd highest of 384 metros
> Population without health insurance: 9.1% — 161st highest of 384 metros
> Median household income: $53,547 — 107th lowest of 384 metros
> Poverty rate: 14.3% — 132nd highest of 384 metros

33. Flint, MI
> Life expectancy at birth (years): 75.5
> Adults reporting poor or fair health: 20.2% — 118th highest of 384 metros
> Adult obesity rate: 35.8% — 82nd highest of 384 metros
> Smoking rate: 23.7% — 31st highest of 384 metros
> Population without health insurance: 5.3% — 69th lowest of 384 metros
> Median household income: $50,389 — 65th lowest of 384 metros
> Poverty rate: 16.5% — 72nd highest of 384 metros

32. Morristown, TN
> Life expectancy at birth (years): 75.4
> Adults reporting poor or fair health: 24.1% — 20th highest of 384 metros
> Adult obesity rate: 38.1% — 37th highest of 384 metros
> Smoking rate: 26.2% — 3rd highest of 384 metros
> Population without health insurance: 12.5% — 61st highest of 384 metros
> Median household income: $47,326 — 23rd lowest of 384 metros
> Poverty rate: 11.9% — 144th lowest of 384 metros

31. Lake Charles, LA
> Life expectancy at birth (years): 75.4
> Adults reporting poor or fair health: 20.8% — 100th highest of 384 metros
> Adult obesity rate: 35.8% — 80th highest of 384 metros
> Smoking rate: 22.7% — 51st highest of 384 metros
> Population without health insurance: 8.1% — 189th highest of 384 metros
> Median household income: $51,547 — 82nd lowest of 384 metros
> Poverty rate: 20.4% — 21st highest of 384 metros

30. Sumter, SC
> Life expectancy at birth (years): 75.3
> Adults reporting poor or fair health: 21.9% — 67th highest of 384 metros
> Adult obesity rate: 40.3% — 7th highest of 384 metros
> Smoking rate: 21.0% — 102nd highest of 384 metros
> Population without health insurance: 9.7% — 139th highest of 384 metros
> Median household income: $49,263 — 48th lowest of 384 metros
> Poverty rate: 19.4% — 28th highest of 384 metros

29. Parkersburg-Vienna, WV
> Life expectancy at birth (years): 75.3
> Adults reporting poor or fair health: 23.1% — 39th highest of 384 metros
> Adult obesity rate: 39.4% — 19th highest of 384 metros
> Smoking rate: 25.2% — 10th highest of 384 metros
> Population without health insurance: 5.6% — 80th lowest of 384 metros
> Median household income: $48,680 — 40th lowest of 384 metros
> Poverty rate: 14.6% — 124th highest of 384 metros

28. Vineland-Bridgeton, NJ
> Life expectancy at birth (years): 75.3
> Adults reporting poor or fair health: 25.2% — 17th highest of 384 metros
> Adult obesity rate: 36.5% — 64th highest of 384 metros
> Smoking rate: 22.6% — 55th highest of 384 metros
> Population without health insurance: 9.4% — 151st highest of 384 metros
> Median household income: $54,587 — 119th lowest of 384 metros
> Poverty rate: 13.2% — 176th highest of 384 metros

27. Weirton-Steubenville, WV-OH
> Life expectancy at birth (years): 75.2
> Adults reporting poor or fair health: 20.9% — 96th highest of 384 metros
> Adult obesity rate: 38.4% — 30th highest of 384 metros
> Smoking rate: 25.8% — 5th highest of 384 metros
> Population without health insurance: 8.5% — 173rd highest of 384 metros
> Median household income: $49,510 — 49th lowest of 384 metros
> Poverty rate: 14.7% — 123rd highest of 384 metros

26. Mobile, AL
> Life expectancy at birth (years): 75.2
> Adults reporting poor or fair health: 21.2% — 86th highest of 384 metros
> Adult obesity rate: 37.8% — 40th highest of 384 metros
> Smoking rate: 20.8% — 108th highest of 384 metros
> Population without health insurance: 11.2% — 95th highest of 384 metros
> Median household income: $49,561 — 51st lowest of 384 metros
> Poverty rate: 17.7% — 54th highest of 384 metros
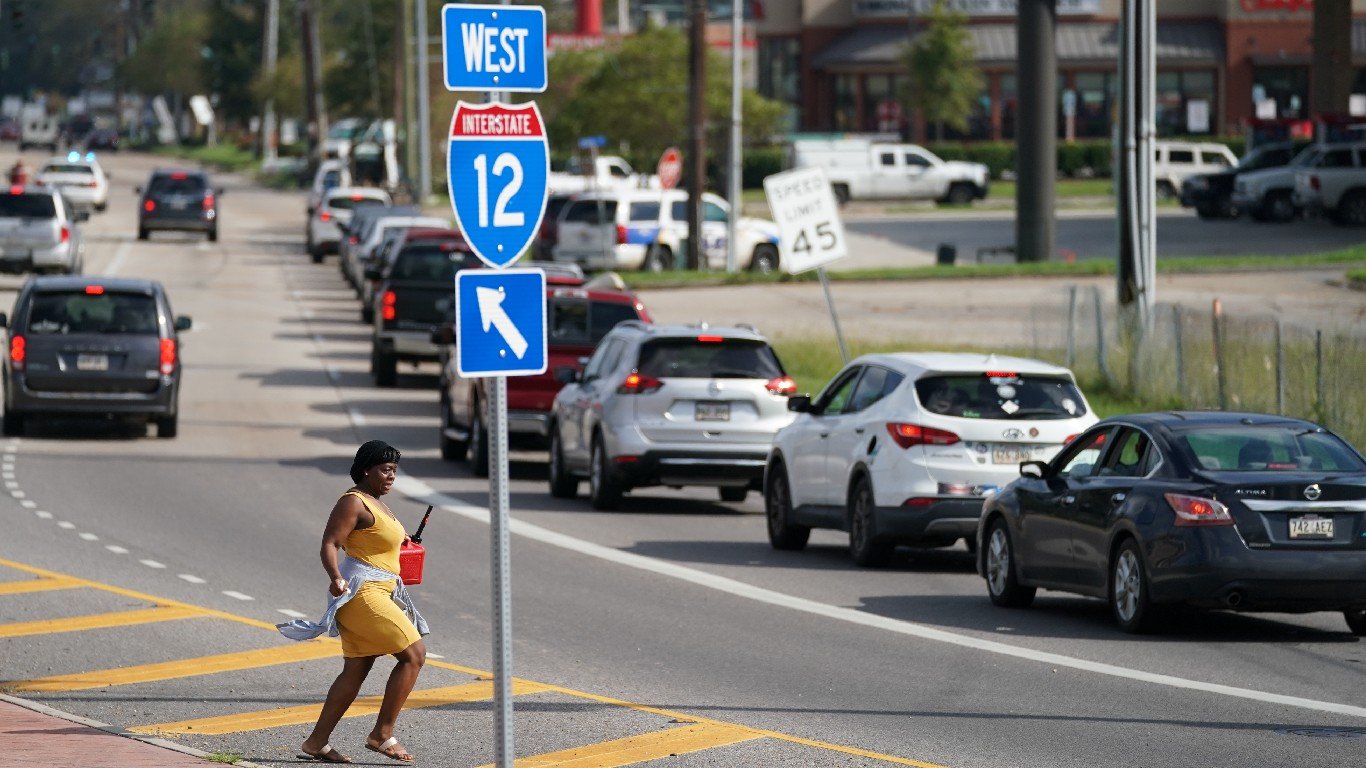
25. Hammond, LA
> Life expectancy at birth (years): 75.2
> Adults reporting poor or fair health: 23.1% — 38th highest of 384 metros
> Adult obesity rate: 40.3% — 8th highest of 384 metros
> Smoking rate: 24.0% — 26th highest of 384 metros
> Population without health insurance: 9.0% — 163rd highest of 384 metros
> Median household income: $47,825 — 29th lowest of 384 metros
> Poverty rate: 22.9% — 7th highest of 384 metros

24. Johnson City, TN
> Life expectancy at birth (years): 75.2
> Adults reporting poor or fair health: 21.8% — 68th highest of 384 metros
> Adult obesity rate: 34.5% — 115th highest of 384 metros
> Smoking rate: 24.3% — 23rd highest of 384 metros
> Population without health insurance: 11.0% — 105th highest of 384 metros
> Median household income: $45,917 — 18th lowest of 384 metros
> Poverty rate: 17.9% — 52nd highest of 384 metros

23. Rome, GA
> Life expectancy at birth (years): 75.2
> Adults reporting poor or fair health: 22.0% — 65th highest of 384 metros
> Adult obesity rate: 34.3% — 122nd highest of 384 metros
> Smoking rate: 21.2% — 96th highest of 384 metros
> Population without health insurance: 14.8% — 27th highest of 384 metros
> Median household income: $50,880 — 74th lowest of 384 metros
> Poverty rate: 16.6% — 71st highest of 384 metros

22. Monroe, LA
> Life expectancy at birth (years): 75.2
> Adults reporting poor or fair health: 23.8% — 25th highest of 384 metros
> Adult obesity rate: 42.0% — 4th highest of 384 metros
> Smoking rate: 24.0% — 27th highest of 384 metros
> Population without health insurance: 8.1% — 190th highest of 384 metros
> Median household income: $40,136 — the lowest of 384 metros
> Poverty rate: 26.0% — 2nd highest of 384 metros

21. Macon-Bibb County, GA
> Life expectancy at birth (years): 75.1
> Adults reporting poor or fair health: 22.2% — 60th highest of 384 metros
> Adult obesity rate: 38.5% — 28th highest of 384 metros
> Smoking rate: 20.8% — 110th highest of 384 metros
> Population without health insurance: 11.0% — 103rd highest of 384 metros
> Median household income: $48,435 — 34th lowest of 384 metros
> Poverty rate: 19.2% — 31st highest of 384 metros
20. Decatur, AL
> Life expectancy at birth (years): 75.1
> Adults reporting poor or fair health: 21.1% — 89th highest of 384 metros
> Adult obesity rate: 35.0% — 102nd highest of 384 metros
> Smoking rate: 21.6% — 78th highest of 384 metros
> Population without health insurance: 10.3% — 124th highest of 384 metros
> Median household income: $53,447 — 103rd lowest of 384 metros
> Poverty rate: 15.5% — 104th highest of 384 metros

19. Hot Springs, AR
> Life expectancy at birth (years): 75.1
> Adults reporting poor or fair health: 22.7% — 45th highest of 384 metros
> Adult obesity rate: 28.8% — 95th lowest of 384 metros
> Smoking rate: 22.7% — 50th highest of 384 metros
> Population without health insurance: 11.0% — 104th highest of 384 metros
> Median household income: $45,265 — 16th lowest of 384 metros
> Poverty rate: 17.4% — 60th highest of 384 metros

18. Columbus, GA-AL
> Life expectancy at birth (years): 75.0
> Adults reporting poor or fair health: 21.0% — 92nd highest of 384 metros
> Adult obesity rate: 37.2% — 51st highest of 384 metros
> Smoking rate: 19.6% — 171st highest of 384 metros
> Population without health insurance: 9.9% — 134th highest of 384 metros
> Median household income: $49,013 — 45th lowest of 384 metros
> Poverty rate: 16.5% — 74th highest of 384 metros

17. Carson City, NV
> Life expectancy at birth (years): 75.0
> Adults reporting poor or fair health: 20.6% — 103rd highest of 384 metros
> Adult obesity rate: 30.9% — 152nd lowest of 384 metros
> Smoking rate: 19.8% — 158th highest of 384 metros
> Population without health insurance: 14.8% — 28th highest of 384 metros
> Median household income: $57,270 — 157th lowest of 384 metros
> Poverty rate: 12.5% — 178th lowest of 384 metros

16. Odessa, TX
> Life expectancy at birth (years): 74.9
> Adults reporting poor or fair health: 24.0% — 22nd highest of 384 metros
> Adult obesity rate: 37.3% — 50th highest of 384 metros
> Smoking rate: 17.1% — 111th lowest of 384 metros
> Population without health insurance: 21.8% — 5th highest of 384 metros
> Median household income: $67,205 — 93rd highest of 384 metros
> Poverty rate: 10.4% — 85th lowest of 384 metros

15. Texarkana, TX-AR
> Life expectancy at birth (years): 74.9
> Adults reporting poor or fair health: 23.0% — 41st highest of 384 metros
> Adult obesity rate: 42.7% — 2nd highest of 384 metros
> Smoking rate: 22.0% — 65th highest of 384 metros
> Population without health insurance: 13.6% — 41st highest of 384 metros
> Median household income: $51,544 — 81st lowest of 384 metros
> Poverty rate: 14.4% — 128th highest of 384 metros

14. Danville, IL
> Life expectancy at birth (years): 74.9
> Adults reporting poor or fair health: 21.1% — 90th highest of 384 metros
> Adult obesity rate: 43.2% — the highest of 384 metros
> Smoking rate: 24.1% — 25th highest of 384 metros
> Population without health insurance: 5.0% — 59th lowest of 384 metros
> Median household income: $43,111 — 8th lowest of 384 metros
> Poverty rate: 16.5% — 75th highest of 384 metros

13. Albany, GA
> Life expectancy at birth (years): 74.9
> Adults reporting poor or fair health: 24.2% — 19th highest of 384 metros
> Adult obesity rate: 39.7% — 11th highest of 384 metros
> Smoking rate: 21.7% — 75th highest of 384 metros
> Population without health insurance: 17.0% — 15th highest of 384 metros
> Median household income: $40,625 — 2nd lowest of 384 metros
> Poverty rate: 22.6% — 10th highest of 384 metros

12. Muncie, IN
> Life expectancy at birth (years): 74.8
> Adults reporting poor or fair health: 21.3% — 83rd highest of 384 metros
> Adult obesity rate: 33.7% — 138th highest of 384 metros
> Smoking rate: 25.0% — 15th highest of 384 metros
> Population without health insurance: 9.4% — 148th highest of 384 metros
> Median household income: $45,065 — 14th lowest of 384 metros
> Poverty rate: 22.8% — 9th highest of 384 metros

11. Alexandria, LA
> Life expectancy at birth (years): 74.6
> Adults reporting poor or fair health: 23.1% — 40th highest of 384 metros
> Adult obesity rate: 40.4% — 6th highest of 384 metros
> Smoking rate: 24.9% — 16th highest of 384 metros
> Population without health insurance: 10.1% — 130th highest of 384 metros
> Median household income: $50,553 — 69th lowest of 384 metros
> Poverty rate: 17.6% — 57th highest of 384 metros

10. Rocky Mount, NC
> Life expectancy at birth (years): 74.6
> Adults reporting poor or fair health: 23.5% — 34th highest of 384 metros
> Adult obesity rate: 38.9% — 21st highest of 384 metros
> Smoking rate: 22.4% — 60th highest of 384 metros
> Population without health insurance: 9.5% — 145th highest of 384 metros
> Median household income: $46,466 — 20th lowest of 384 metros
> Poverty rate: 17.2% — 63rd highest of 384 metros
9. Kokomo, IN
> Life expectancy at birth (years): 74.5
> Adults reporting poor or fair health: 20.2% — 120th highest of 384 metros
> Adult obesity rate: 35.2% — 93rd highest of 384 metros
> Smoking rate: 25.2% — 13th highest of 384 metros
> Population without health insurance: 11.7% — 81st highest of 384 metros
> Median household income: $53,440 — 102nd lowest of 384 metros
> Poverty rate: 11.9% — 145th lowest of 384 metros
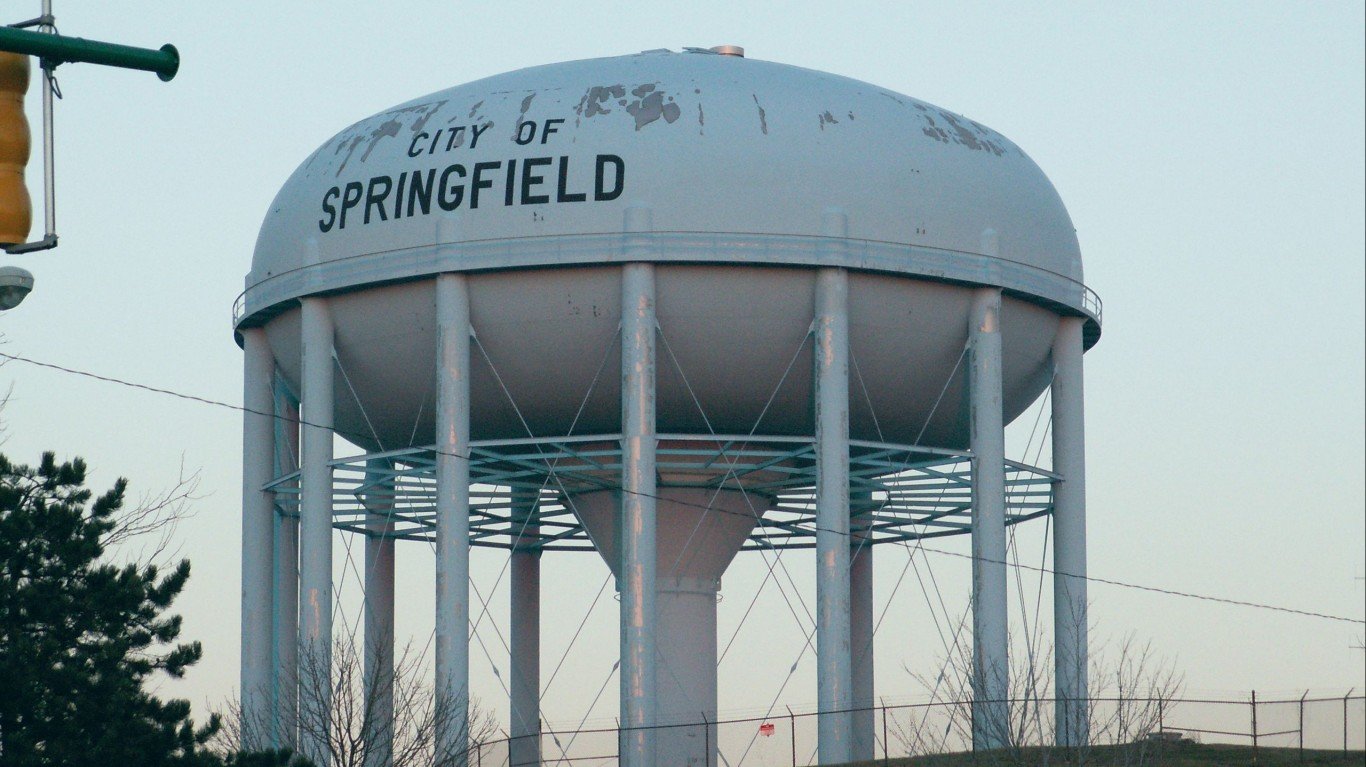
8. Springfield, OH
> Life expectancy at birth (years): 74.3
> Adults reporting poor or fair health: 20.9% — 98th highest of 384 metros
> Adult obesity rate: 37.0% — 55th highest of 384 metros
> Smoking rate: 26.2% — 2nd highest of 384 metros
> Population without health insurance: 6.6% — 131st lowest of 384 metros
> Median household income: $50,128 — 59th lowest of 384 metros
> Poverty rate: 14.6% — 125th highest of 384 metros
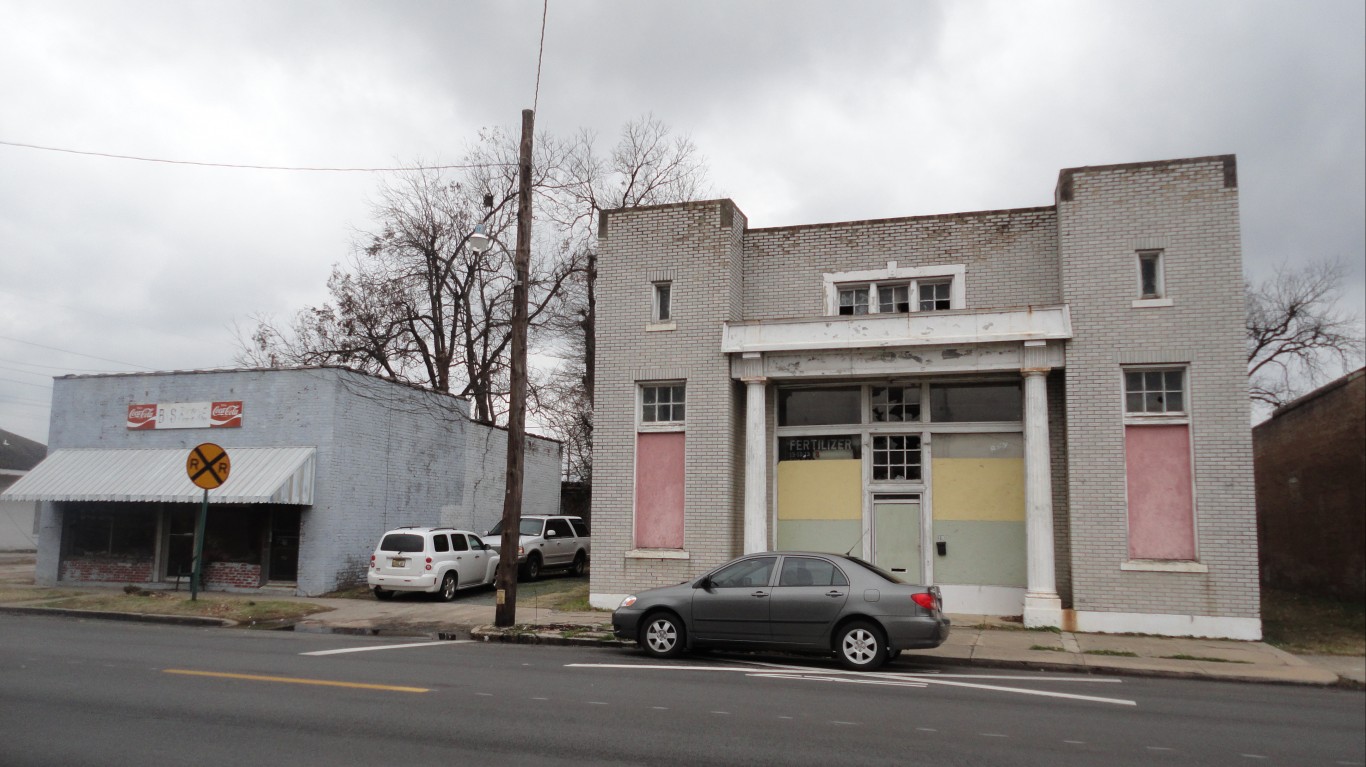
7. Pine Bluff, AR
> Life expectancy at birth (years): 73.8
> Adults reporting poor or fair health: 28.0% — 7th highest of 384 metros
> Adult obesity rate: 42.5% — 3rd highest of 384 metros
> Smoking rate: 25.2% — 11th highest of 384 metros
> Population without health insurance: 7.2% — 155th lowest of 384 metros
> Median household income: $41,541 — 5th lowest of 384 metros
> Poverty rate: 23.6% — 6th highest of 384 metros
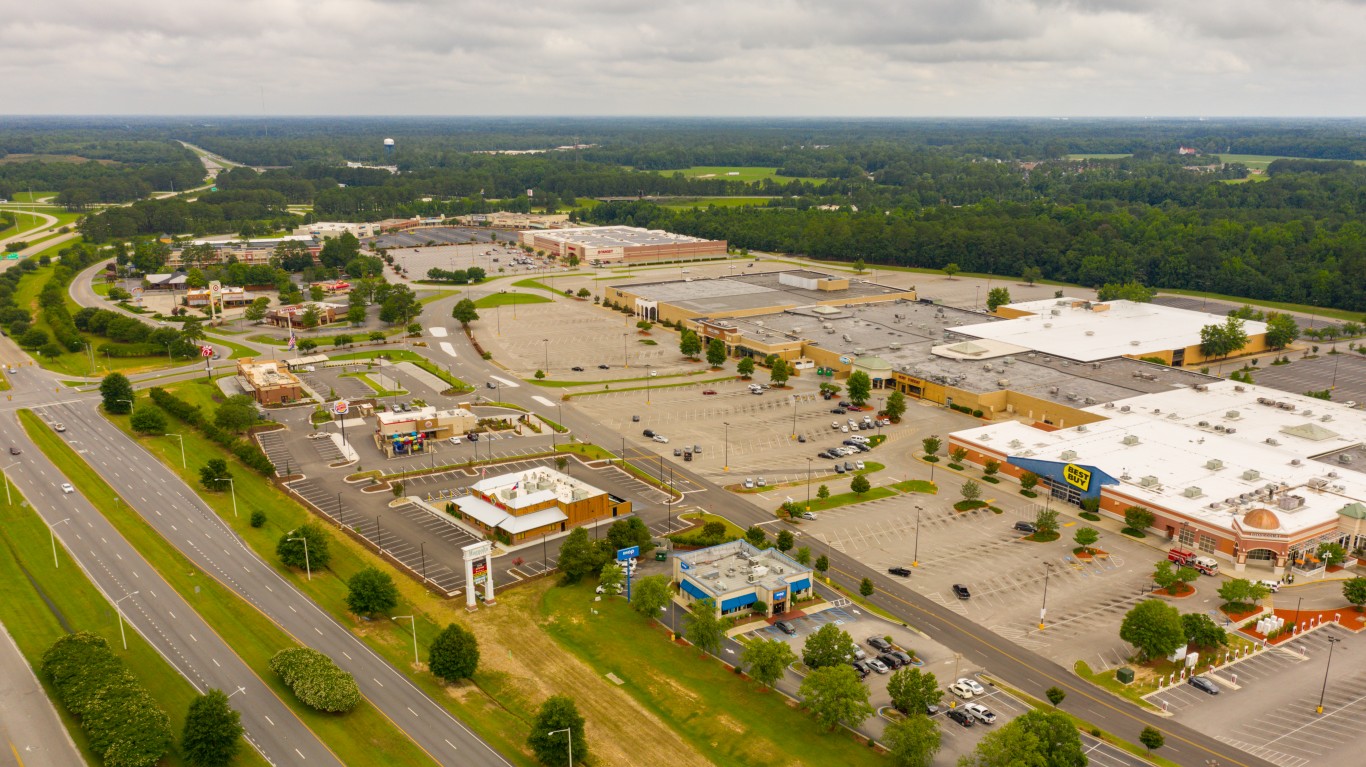
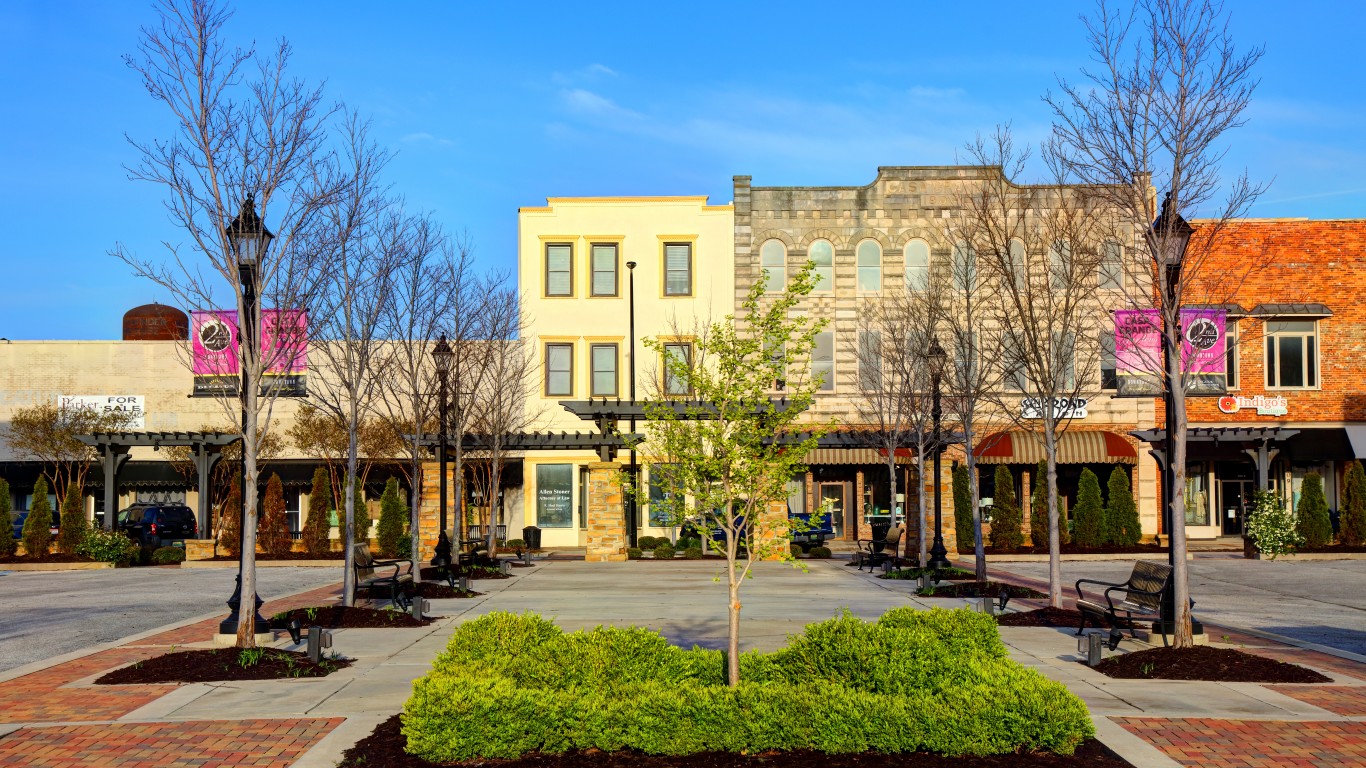
6. Florence, SC
> Life expectancy at birth (years): 73.7
> Adults reporting poor or fair health: 21.5% — 78th highest of 384 metros
> Adult obesity rate: 38.4% — 31st highest of 384 metros
> Smoking rate: 20.6% — 117th highest of 384 metros
> Population without health insurance: 11.1% — 98th highest of 384 metros
> Median household income: $48,547 — 37th lowest of 384 metros
> Poverty rate: 16.9% — 67th highest of 384 metros

5. Huntington-Ashland, WV-KY-OH
> Life expectancy at birth (years): 73.5
> Adults reporting poor or fair health: 23.2% — 36th highest of 384 metros
> Adult obesity rate: 39.6% — 17th highest of 384 metros
> Smoking rate: 25.6% — 9th highest of 384 metros
> Population without health insurance: 7.9% — 186th lowest of 384 metros
> Median household income: $48,329 — 32nd lowest of 384 metros
> Poverty rate: 16.9% — 65th highest of 384 metros
4. Anniston-Oxford, AL
> Life expectancy at birth (years): 73.5
> Adults reporting poor or fair health: 23.7% — 29th highest of 384 metros
> Adult obesity rate: 39.7% — 12th highest of 384 metros
> Smoking rate: 21.2% — 91st highest of 384 metros
> Population without health insurance: 11.1% — 99th highest of 384 metros
> Median household income: $48,156 — 30th lowest of 384 metros
> Poverty rate: 17.3% — 62nd highest of 384 metros

3. Gadsden, AL
> Life expectancy at birth (years): 73.3
> Adults reporting poor or fair health: 22.0% — 64th highest of 384 metros
> Adult obesity rate: 36.2% — 73rd highest of 384 metros
> Smoking rate: 23.1% — 38th highest of 384 metros
> Population without health insurance: 13.2% — 47th highest of 384 metros
> Median household income: $41,447 — 4th lowest of 384 metros
> Poverty rate: 19.7% — 25th highest of 384 metros

2. Charleston, WV
> Life expectancy at birth (years): 73.1
> Adults reporting poor or fair health: 22.9% — 43rd highest of 384 metros
> Adult obesity rate: 38.3% — 32nd highest of 384 metros
> Smoking rate: 26.0% — 4th highest of 384 metros
> Population without health insurance: 5.9% — 101st lowest of 384 metros
> Median household income: $47,500 — 25th lowest of 384 metros
> Poverty rate: 17.1% — 64th highest of 384 metros

1. Beckley, WV
> Life expectancy at birth (years): 72.7
> Adults reporting poor or fair health: 25.6% — 15th highest of 384 metros
> Adult obesity rate: 38.9% — 23rd highest of 384 metros
> Smoking rate: 27.9% — the highest of 384 metros
> Population without health insurance: 7.2% — 157th lowest of 384 metros
> Median household income: $44,785 — 12th lowest of 384 metros
> Poverty rate: 17.9% — 51st highest of 384 metros
Methodology
To determine the metro areas with the shortest life expectancy, 24/7 Tempo reviewed life expectancy — the average number of years a person can expect to live — data from the Robert Wood Johnson Foundation and the University of Wisconsin Population Health Institute joint program’s 2021 County Health Rankings & Roadmaps report. While the CHR report is from 2021, life expectancy data published in the report are from 2017-2019.
We used the 384 metropolitan statistical areas as delineated by the United States Office of Management and Budget and used by the Census Bureau as our definition of metros.
Metros were ranked based on life expectancy. Additional information on the share of adults reporting poor or fair health, the share of adults 20 years and older who report a body mass index of 30 kg/m2 or higher (adult obesity rate), and the share of adults who are current smokers are also from the 2021 CHR. The share of the civilian noninstitutionalized population without health insurance, median household income, and poverty rates are one-year estimates from the U.S. Census Bureau’s 2019 American Community Survey.