
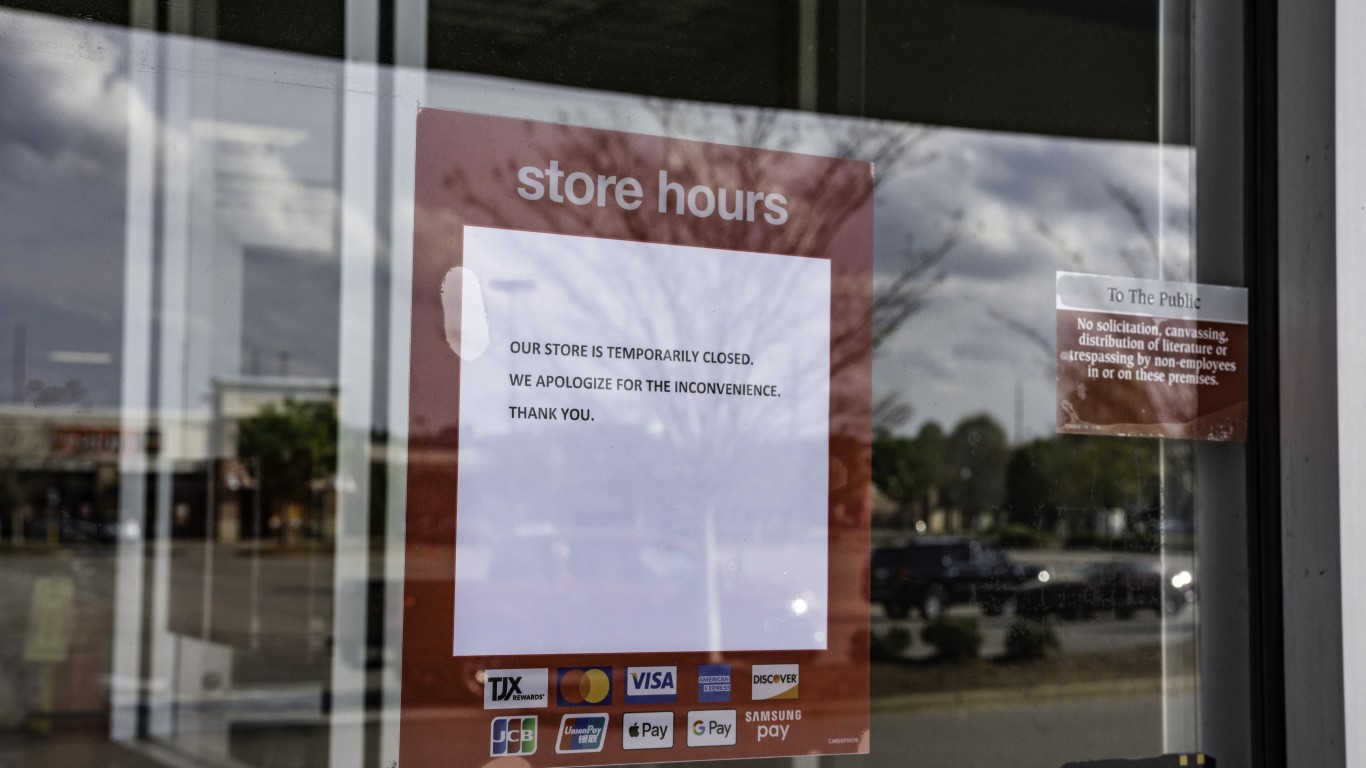
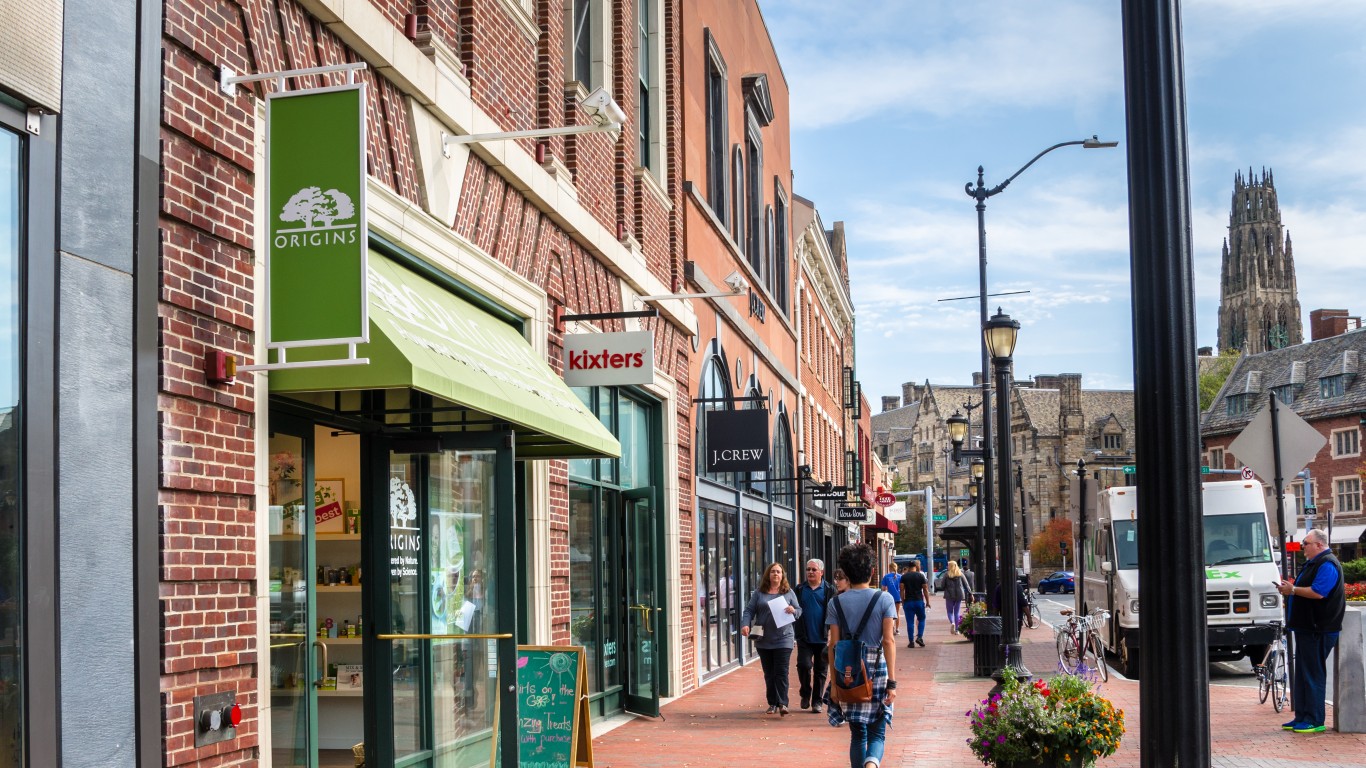
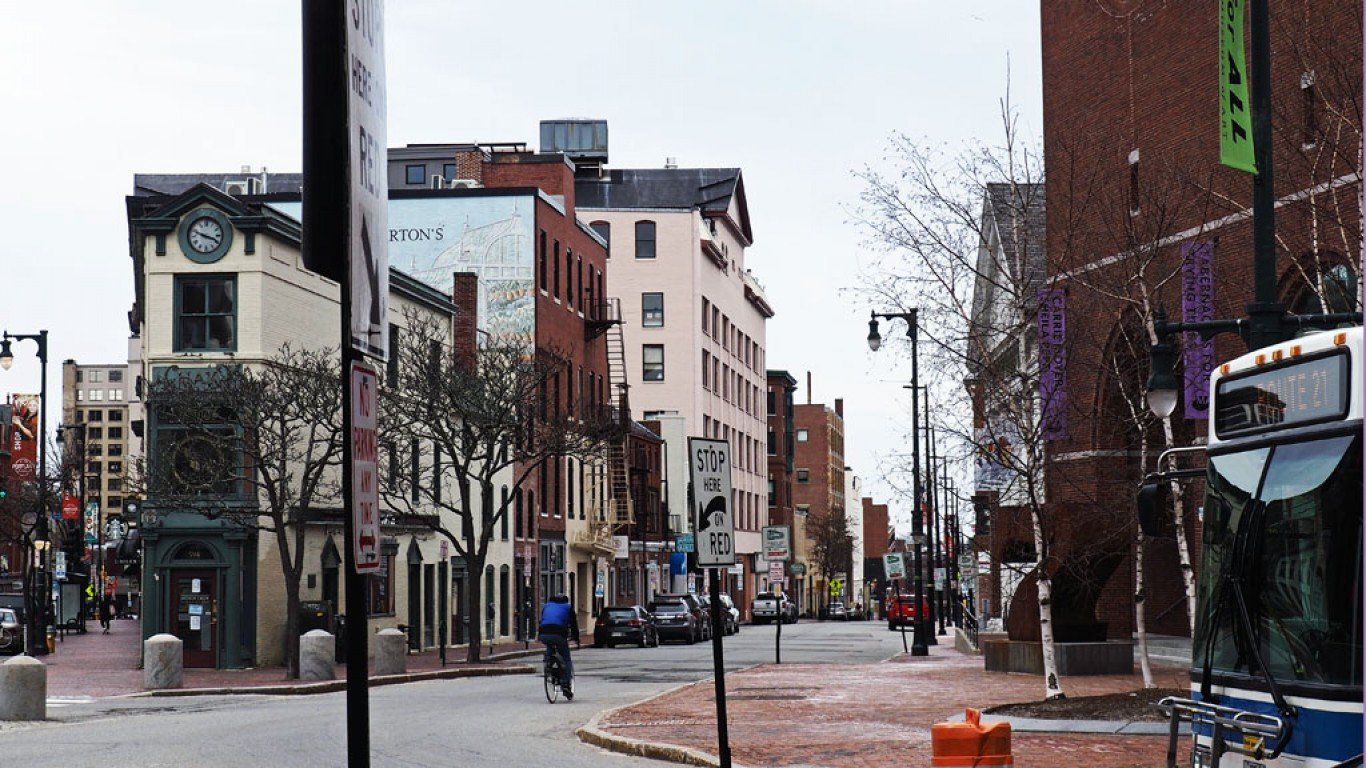
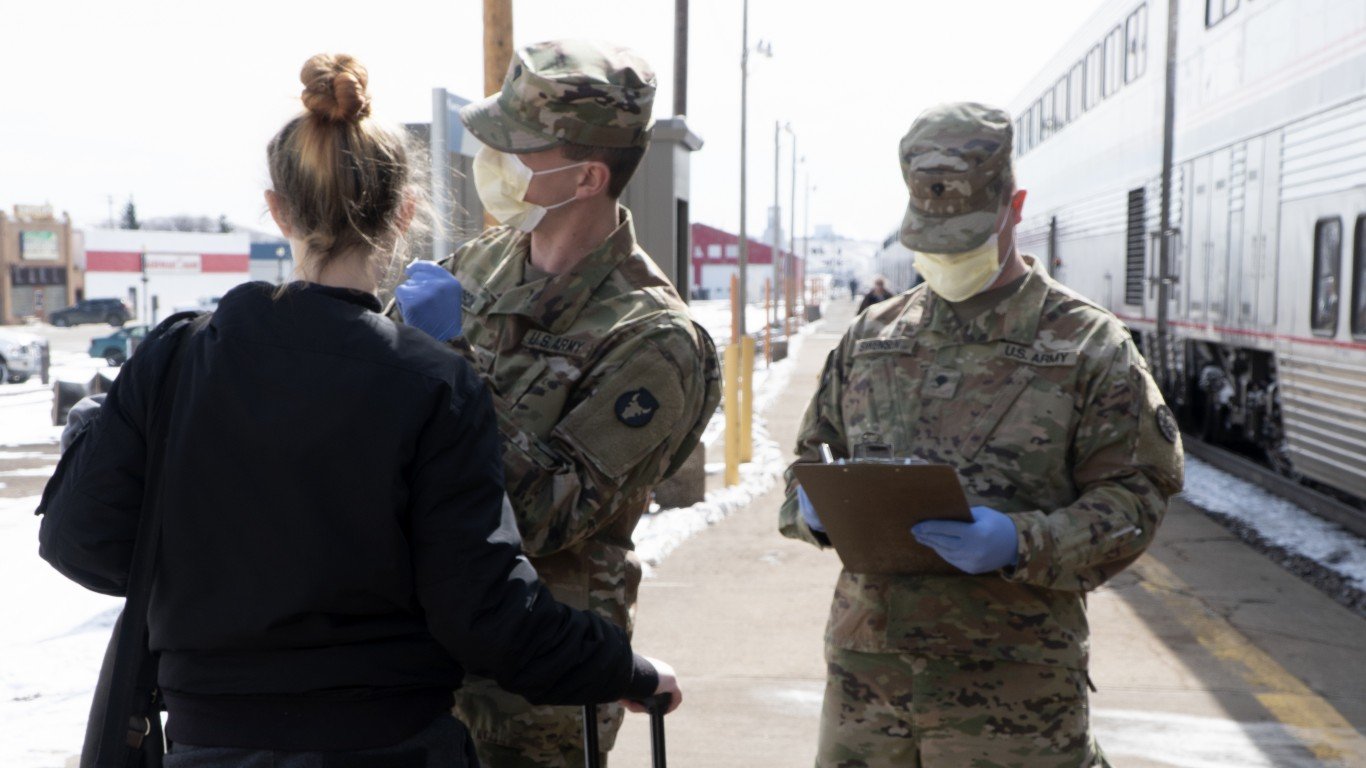
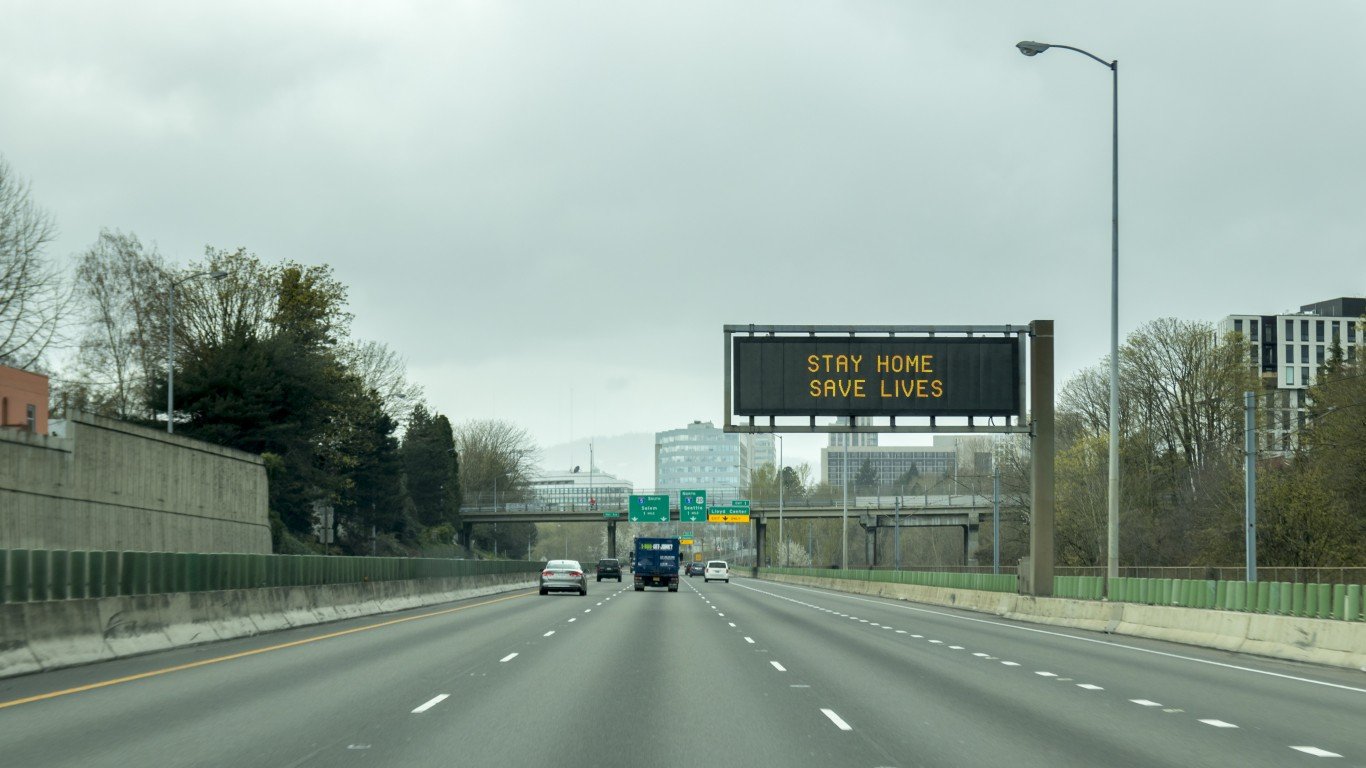
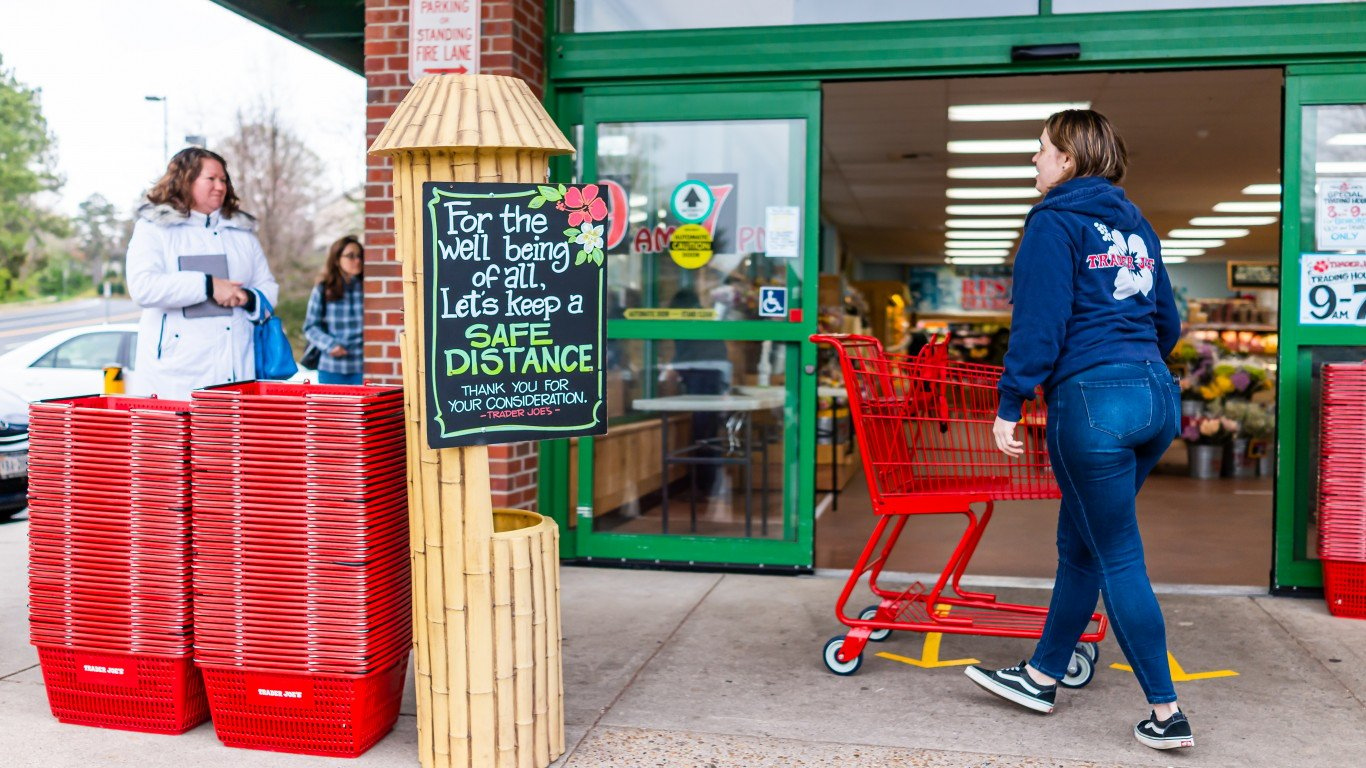
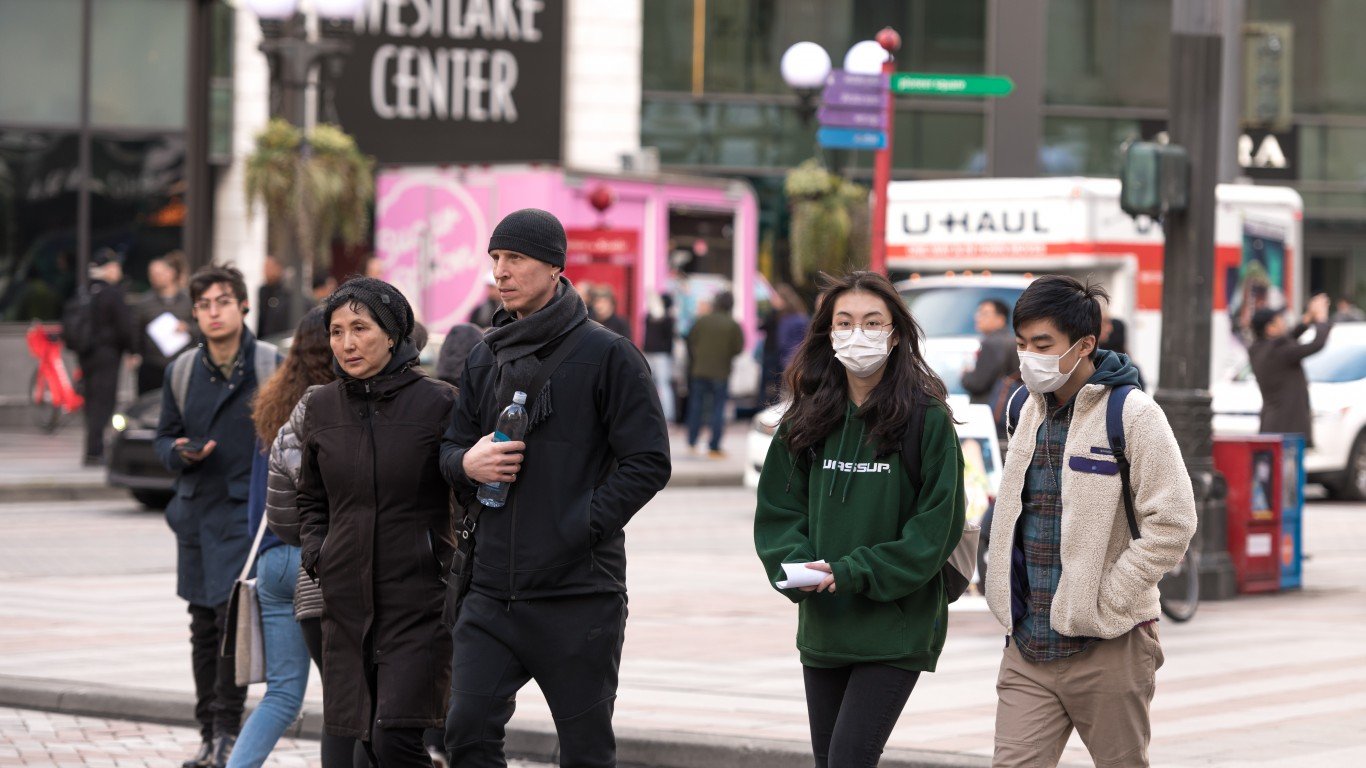
The scale of the coronavirus pandemic in the United States is reshaping society in lasting ways – from how we work and buy groceries to the level of freedom of movement we are accustomed to. With stay-at-home orders — each with a different set of restrictive rules — in effect in all but eight states, where people are going and how they are spending their time outside has changed significantly.
24/7 Tempo analyzed population mobility data from Google Maps to determine how the geographic movement of people has changed in every state.
In the five weeks from March 8 through April 11, during which stay-at-home orders for states that issues them were still in effect and the primary concern was flattening the curve and not reopening state economies, Americans were moving — as in going to a place outside — on average 15.4% less than during the period between Jan. 3 and Feb. 6 — Google’s baseline to compare social distancing behavior.
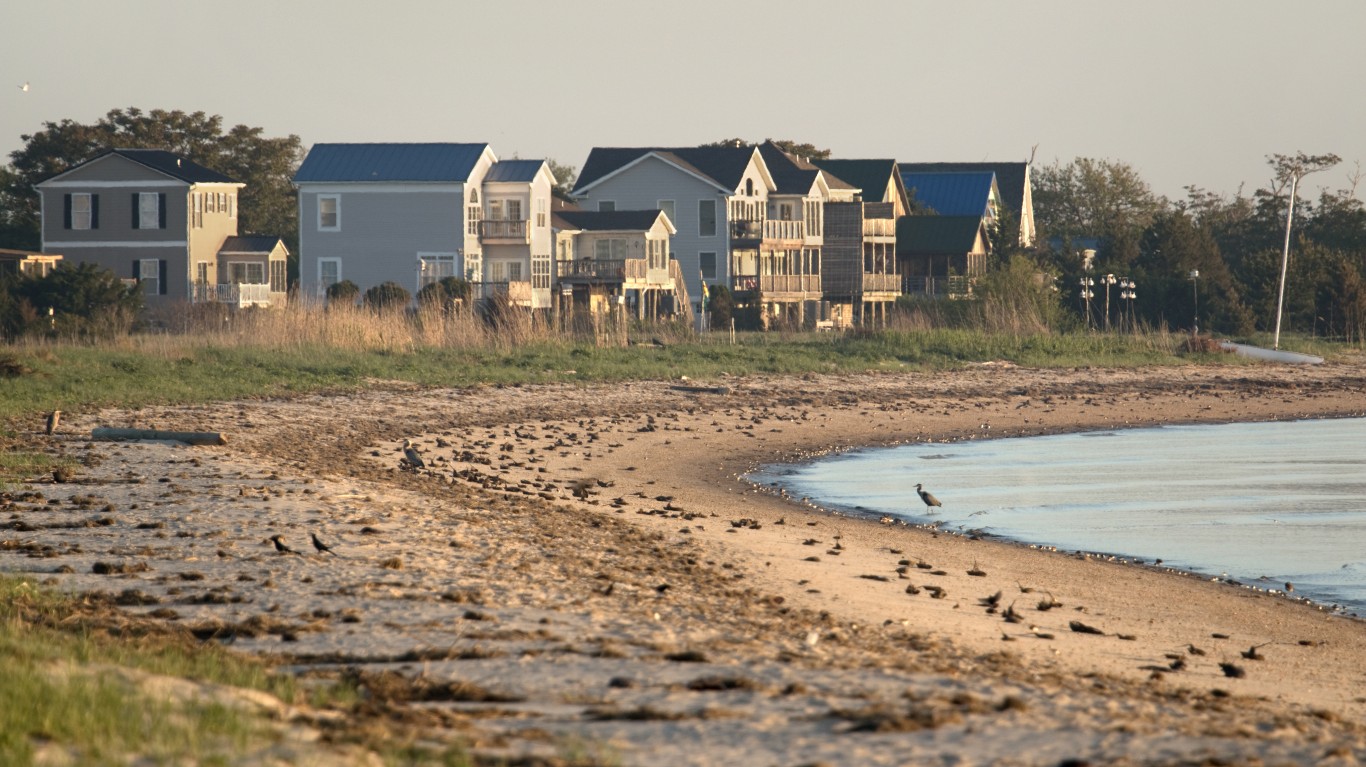
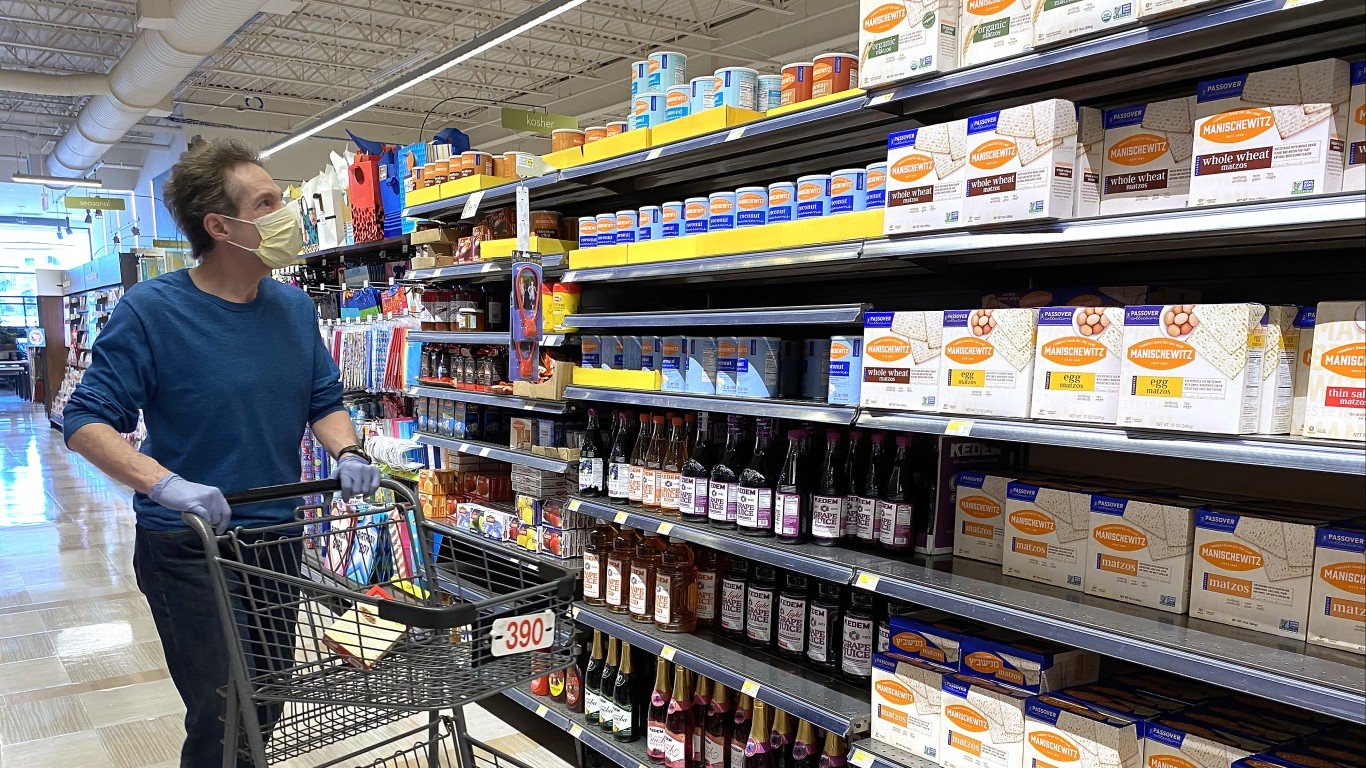
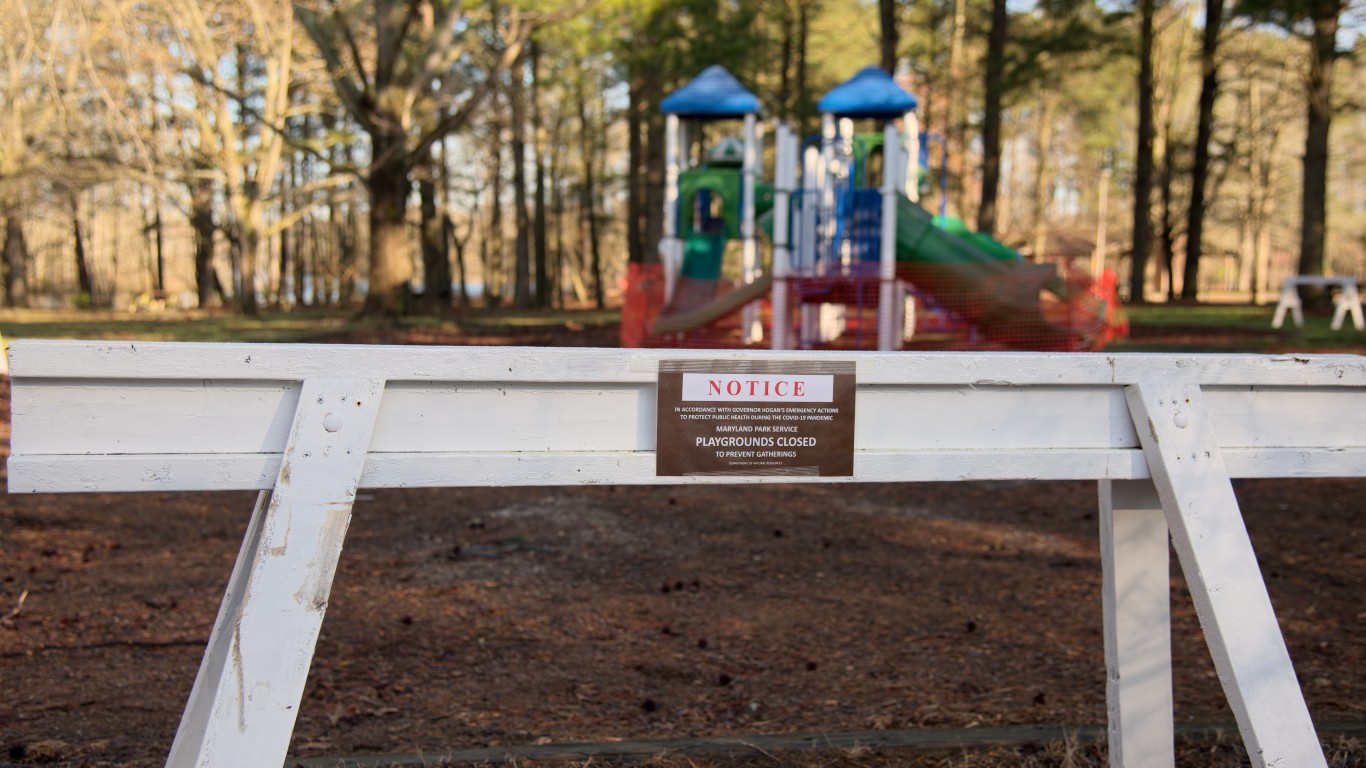
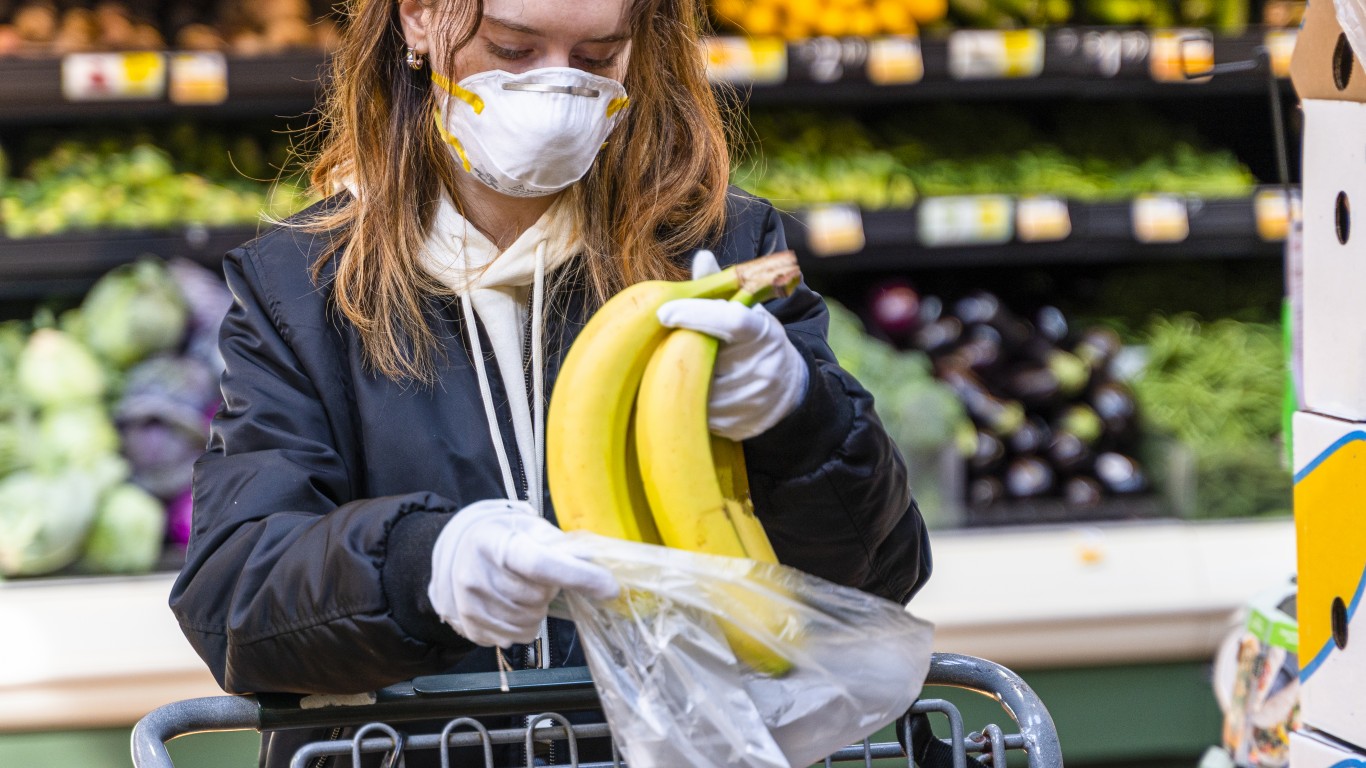
The places we reviewed include recreation mobility like restaurants, shopping centers, and movie theaters; grocery and pharmacy mobility; parks mobility like public parks and beaches; and transit stations mobility subway, bus, and train stations.
The changes in movement vary greatly from state to state. The restrictiveness of stay-at-home orders or the lack of such directives appear to play a role in how people’s movement has changed.
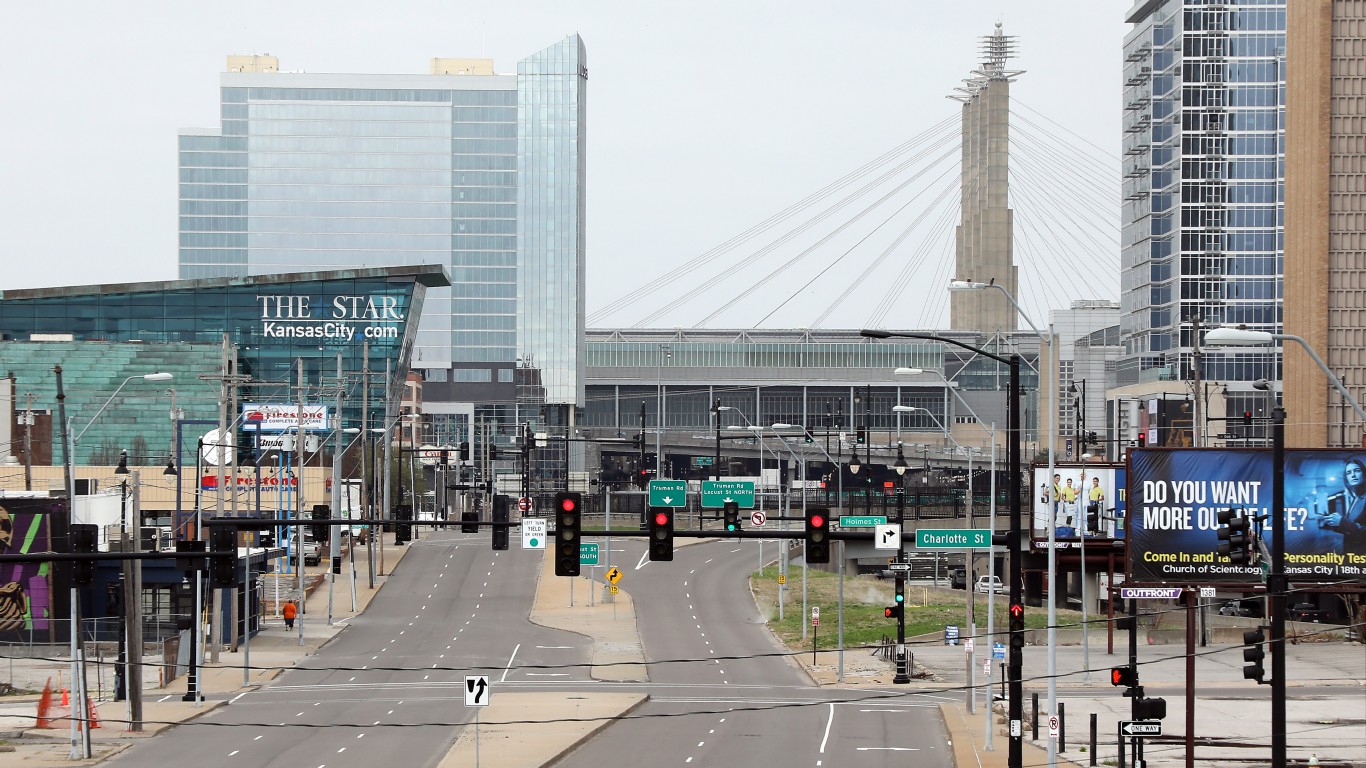
The biggest change across the country has been in using public transportation. There was a 36.3% decline between the March 8-April 11 period and the Jan. 3–Feb 6 period. The mobility trend for places like public transport hubs such as subway, bus, and train stations were negative in all 50 states as people were ordered to work from home if possible and were strongly encouraged to avoid public transit as much as possible — even in states with no stay-at-home orders.
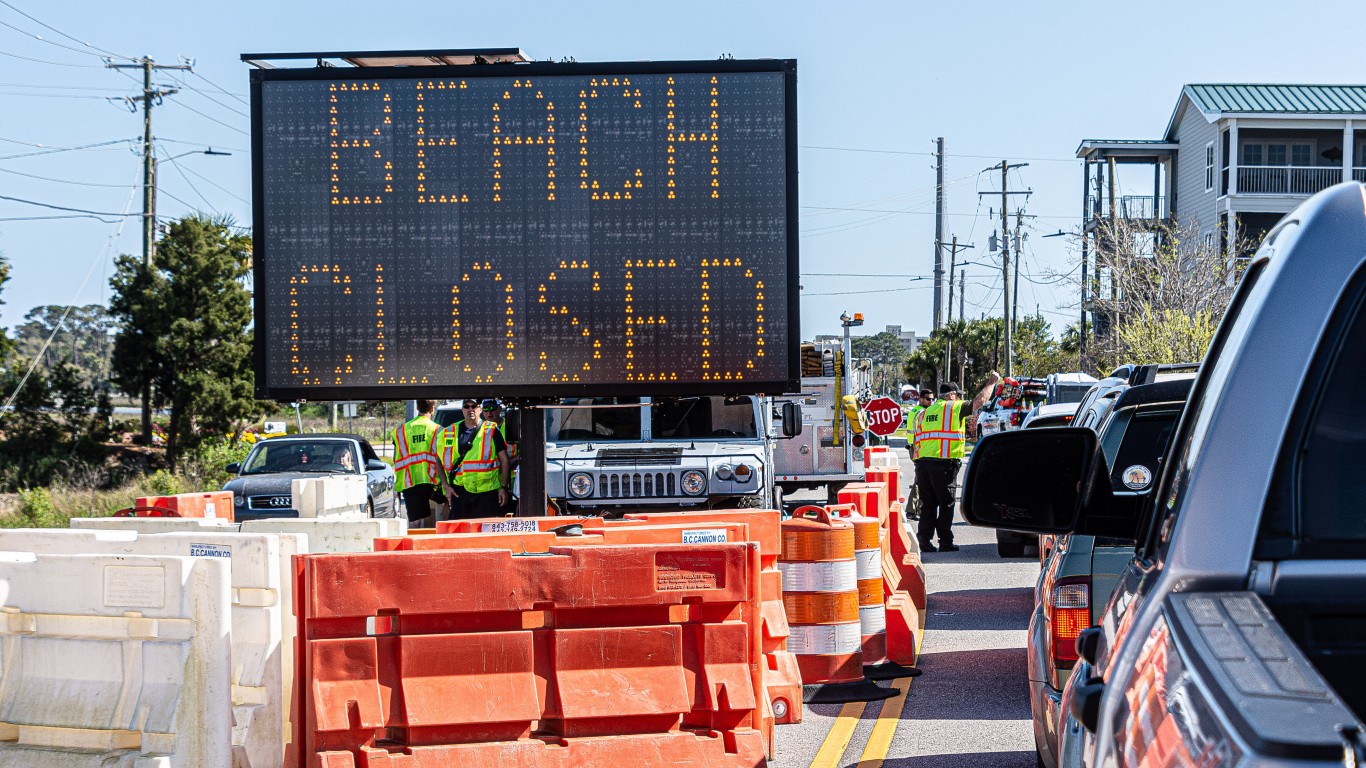
Half of the states with the smallest declines in mobility have never issued statewide stay-at-home orders. States with the biggest increases in visits to public parks usually allowed parks to remain open. For example, in Kansas, where gyms and workout facilities were closed, parks mobility increased by 47.8%, the second highest increase in the country. State residents were encouraged to use parks and exercise outdoors. In contrast, Hawaii, the state with the largest decline in park visits — 44.9% between March 8 and April 11 — closed state parks, historical sites, and recreation areas.
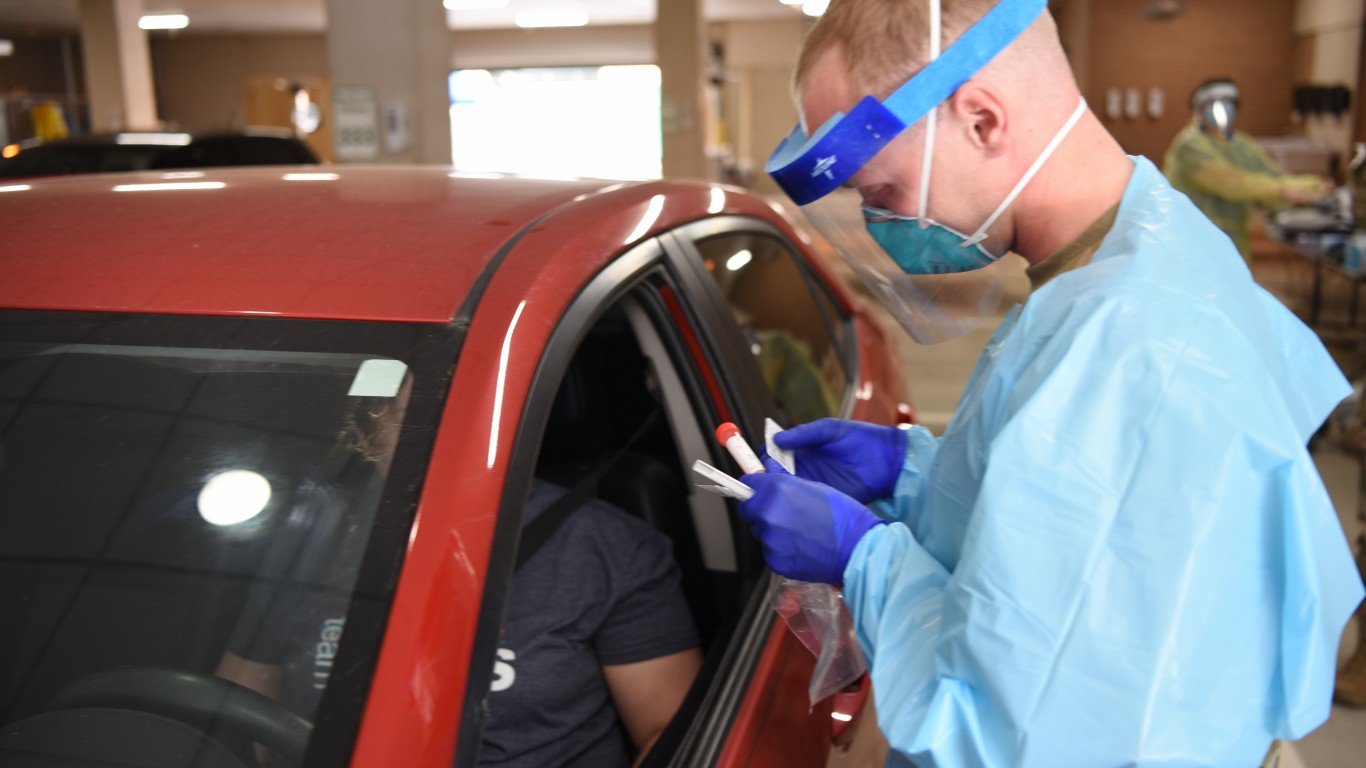
As of April 29, the number of recorded cases of COVID-19 in the United States surpassed 1 million. Although the spread of the pandemic has slowed in some states, others have not even reached the peak yet — these are the states where the coronavirus is spreading the fastest right now.
Alabama
> Avg. change in mobility (Mar 8 – Apr 11): -5.4% — 12th smallest
> Change in retail and recreation mobility: -22.6% — 6th smallest decline
> Change in grocery and pharmacy mobility: +3.6% — 4th largest increase
> Change in parks mobility: +17.1% — 17th smallest increase
> Change in transit stations mobility: -15.1% — 8th smallest decline
> Stay-at-home order effective date: Apr. 4
> 7-day increase in confirmed COVID-19 cases through Apr. 29: +21.3% — 24th lowest
> Confirmed COVID-19 cases as of Apr. 29: 139 per 100,000 — 24th lowest (total: 6,779)
> Population: 4,887,871

Alaska
> Avg. change in mobility (Mar 8 – Apr 11): -9.7% — 25th smallest
> Change in retail and recreation mobility: -25.4% — 19th smallest decline
> Change in grocery and pharmacy mobility: -4.1% — 13th smallest decline
> Change in parks mobility: +18.3% — 19th smallest increase
> Change in transit stations mobility: -30.1% — 25th smallest decline
> Stay-at-home order effective date: Mar. 28
> 7-day increase in confirmed COVID-19 cases through Apr. 29: +4.8% — 4th lowest
> Confirmed COVID-19 cases as of Apr. 29: 48 per 100,000 — 3rd lowest (total: 351)
> Population: 737,438

Arizona
> Avg. change in mobility (Mar 8 – Apr 11): -14.3% — 12th largest
> Change in retail and recreation mobility: -24.9% — 17th smallest decline
> Change in grocery and pharmacy mobility: -4.0% — 12th smallest decline
> Change in parks mobility: -10.8% — 7th largest decline
> Change in transit stations mobility: -26.6% — 22nd smallest decline
> Stay-at-home order effective date: Mar. 31
> 7-day increase in confirmed COVID-19 cases through Apr. 29: +27.3% — 21st highest
> Confirmed COVID-19 cases as of Apr. 29: 97 per 100,000 — 12th lowest (total: 6,948)
> Population: 7,171,646
Arkansas
> Avg. change in mobility (Mar 8 – Apr 11): -1.6% — 4th smallest
> Change in retail and recreation mobility: -19.1% — 2nd smallest decline
> Change in grocery and pharmacy mobility: 2.5% — 11th largest increase
> Change in parks mobility: +36.2% — 7th largest increase
> Change in transit stations mobility: -15.1% — 7th smallest decline
> Stay-at-home order effective date: No statewide stay-at-home order as of April 29
> 7-day increase in confirmed COVID-19 cases through Apr. 29: +37.4% — 8th highest
> Confirmed COVID-19 cases as of Apr. 29: 104 per 100,000 — 14th lowest (total: 3,127)
> Population: 3,013,825

California
> Avg. change in mobility (Mar 8 – Apr 11): -22.0% — 3rd largest
> Change in retail and recreation mobility: -33.2% — 7th largest decline
> Change in grocery and pharmacy mobility: -8.1% — 7th largest decline
> Change in parks mobility: -28.0% — 3rd largest decline
> Change in transit stations mobility: -43.1% — 7th largest decline
> Stay-at-home order effective date: Mar. 19
> 7-day increase in confirmed COVID-19 cases through Apr. 29: +24.6% — 24th highest
> Confirmed COVID-19 cases as of Apr. 29: 117 per 100,000 — 18th lowest (total: 46,445)
> Population: 39,557,045

Colorado
> Avg. change in mobility (Mar 8 – Apr 11): -15.8% — 9th largest
> Change in retail and recreation mobility: -31.8% — 12th largest decline
> Change in grocery and pharmacy mobility: -6.1% — 14th largest decline
> Change in parks mobility: +5.6% — 5th smallest increase
> Change in transit stations mobility: -41.3% — 8th largest decline
> Stay-at-home order effective date: Mar. 26
> 7-day increase in confirmed COVID-19 cases through Apr. 29: +31.6% — 16th highest
> Confirmed COVID-19 cases as of Apr. 29: 251 per 100,000 — 13th highest (total: 14,316)
> Population: 5,695,564
Connecticut
> Avg. change in mobility (Mar 8 – Apr 11): -11.9% — 19th largest
> Change in retail and recreation mobility: -31.4% — 14th largest decline
> Change in grocery and pharmacy mobility: -5.2% — 15th smallest decline
> Change in parks mobility: +23.5% — 15th largest increase
> Change in transit stations mobility: -39.3% — 14th largest decline
> Stay-at-home order effective date: Mar. 23
> 7-day increase in confirmed COVID-19 cases through Apr. 29: +17.1% — 14th lowest
> Confirmed COVID-19 cases as of Apr. 29: 736 per 100,000 — 5th highest (total: 26,312)
> Population: 3,572,665
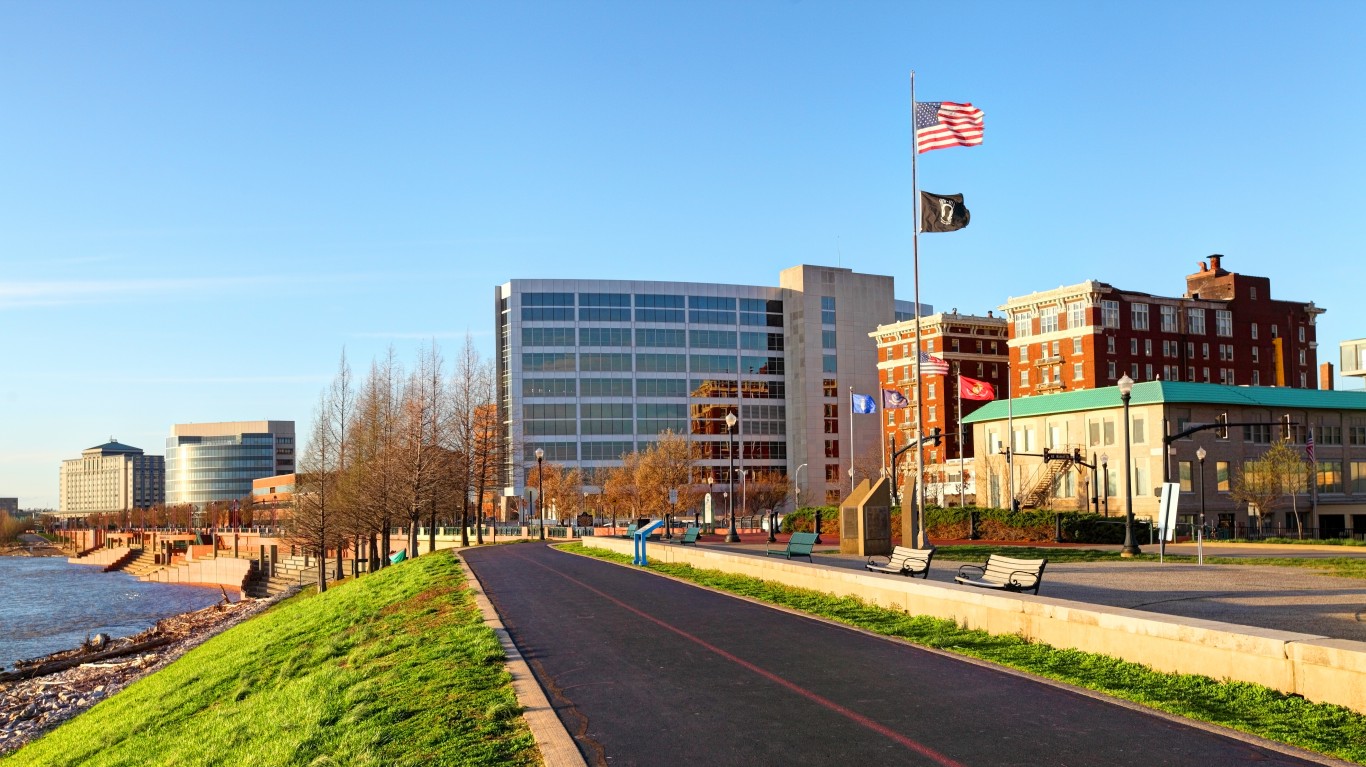
Delaware
> Avg. change in mobility (Mar 8 – Apr 11): -11.8% — 21st largest
> Change in retail and recreation mobility: -26.7% — 23rd smallest decline
> Change in grocery and pharmacy mobility: -10.0% — 3rd largest decline
> Change in parks mobility: +19.3% — 20th smallest increase
> Change in transit stations mobility: -34.9% — 18th largest decline
> Stay-at-home order effective date: Mar. 24
> 7-day increase in confirmed COVID-19 cases through Apr. 29: +43.0% — 7th highest
> Confirmed COVID-19 cases as of Apr. 29: 473 per 100,000 — 7th highest (total: 4,575)
> Population: 967,171

Florida
> Avg. change in mobility (Mar 8 – Apr 11): -20.3% — 5th largest
> Change in retail and recreation mobility: -30.1% — 19th largest decline
> Change in grocery and pharmacy mobility: -7.8% — 8th largest decline
> Change in parks mobility: -25.8% — 4th largest decline
> Change in transit stations mobility: -39.6% — 12th largest decline
> Stay-at-home order effective date: Apr. 3
> 7-day increase in confirmed COVID-19 cases through Apr. 29: +14.9% — 11th lowest
> Confirmed COVID-19 cases as of Apr. 29: 154 per 100,000 — 22nd highest (total: 32,846)
> Population: 21,299,325
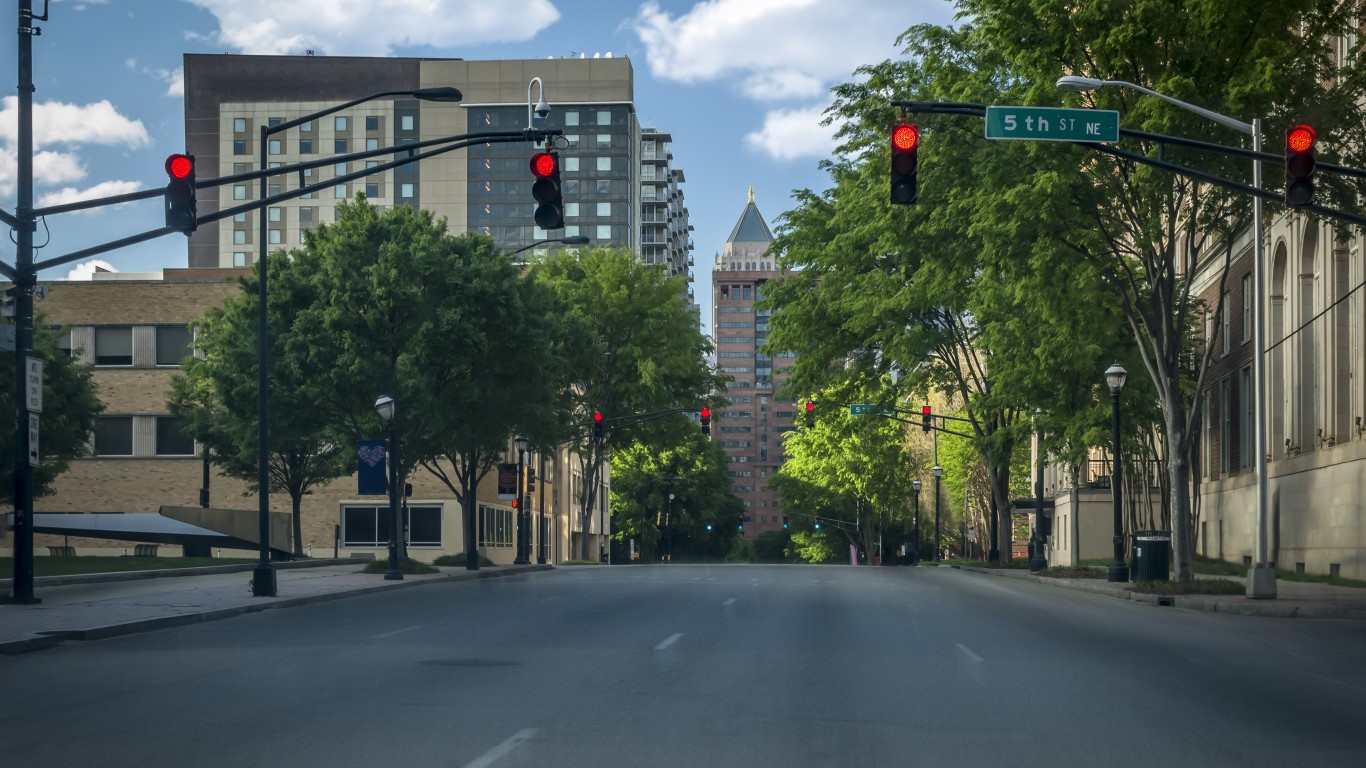
Georgia
> Avg. change in mobility (Mar 8 – Apr 11): -11.6% — 22nd largest
> Change in retail and recreation mobility: -25.3% — 18th smallest decline
> Change in grocery and pharmacy mobility: -0.6% — 3rd smallest decline
> Change in parks mobility: +8.6% — 7th smallest increase
> Change in transit stations mobility: -33.5% — 20th largest decline
> Stay-at-home order effective date: Apr. 3
> 7-day increase in confirmed COVID-19 cases through Apr. 29: +17.8% — 16th lowest
> Confirmed COVID-19 cases as of Apr. 29: 236 per 100,000 — 15th highest (total: 24,854)
> Population: 10,519,475

Hawaii
> Avg. change in mobility (Mar 8 – Apr 11): -26.5% — the largest
> Change in retail and recreation mobility: -34.9% — 6th largest decline
> Change in grocery and pharmacy mobility: -16.2% — the largest decline
> Change in parks mobility: -44.9% — the largest decline
> Change in transit stations mobility: -45.3% — 4th largest decline
> Stay-at-home order effective date: Mar. 25
> 7-day increase in confirmed COVID-19 cases through Apr. 29: +2.9% — 3rd lowest
> Confirmed COVID-19 cases as of Apr. 29: 43 per 100,000 — 2nd lowest (total: 609)
> Population: 1,420,491
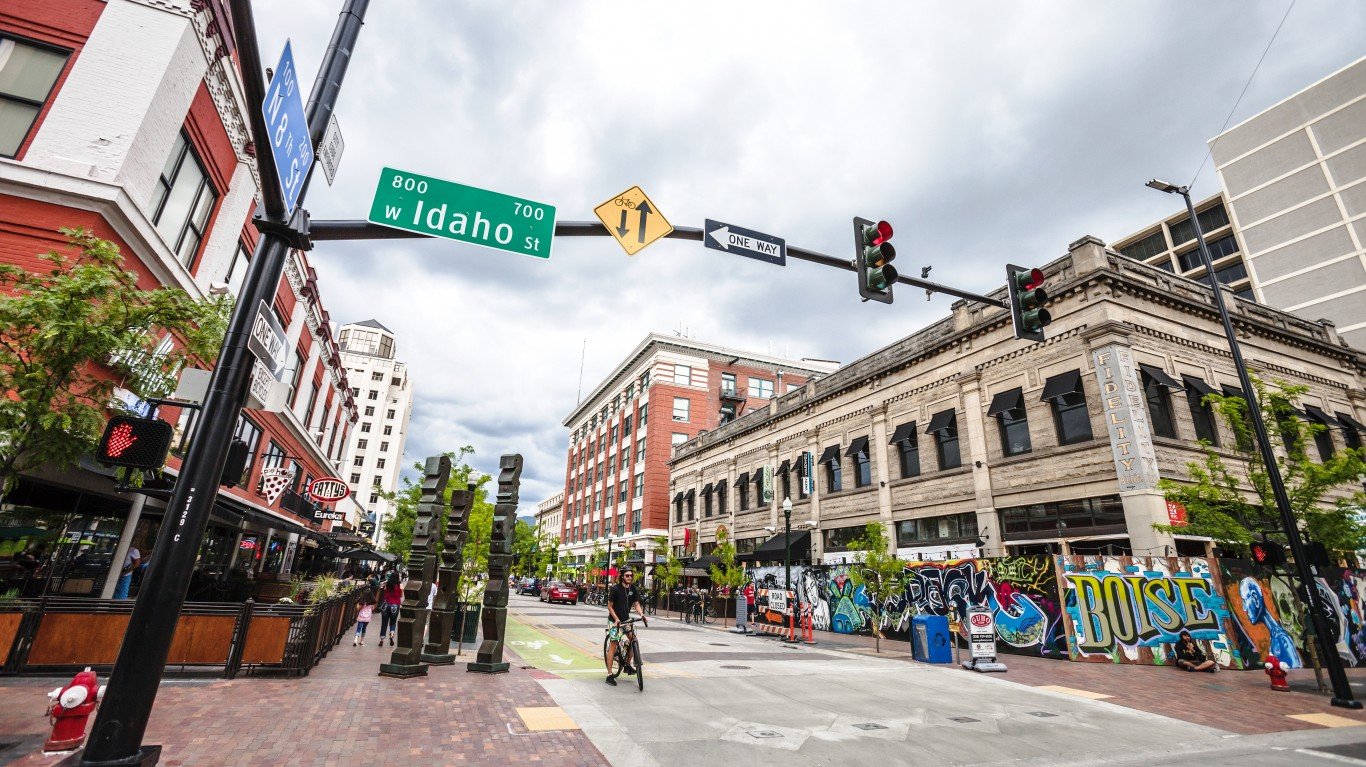
Idaho
> Avg. change in mobility (Mar 8 – Apr 11): -1.2% — 3rd smallest
> Change in retail and recreation mobility: -22.3% — 5th smallest decline
> Change in grocery and pharmacy mobility: +2.9% — 7th largest increase
> Change in parks mobility: +46.0% — 3rd largest increase
> Change in transit stations mobility: -16.5% — 11th smallest decline
> Stay-at-home order effective date: Mar. 25
> 7-day increase in confirmed COVID-19 cases through Apr. 29: +8.6% — 6th lowest
> Confirmed COVID-19 cases as of Apr. 29: 109 per 100,000 — 16th lowest (total: 1,917)
> Population: 1,754,208
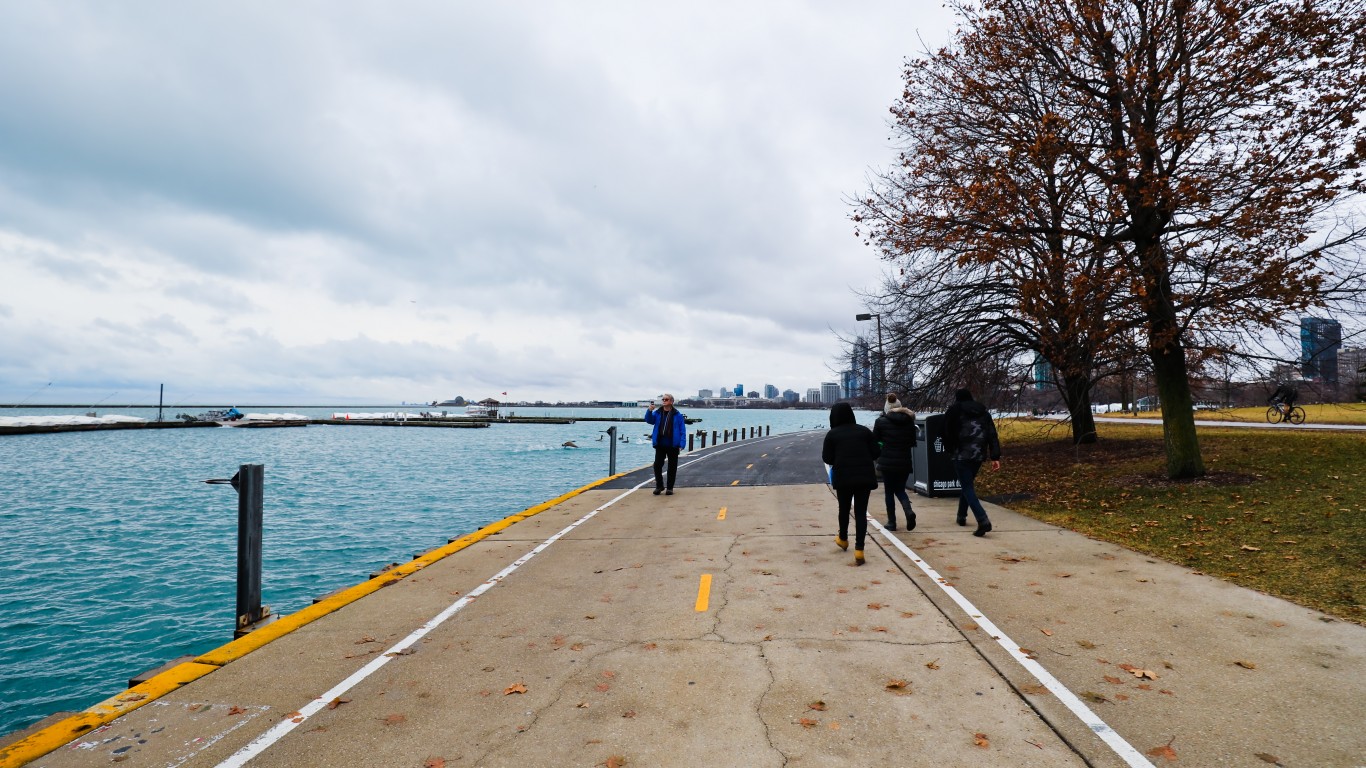
Illinois
> Avg. change in mobility (Mar 8 – Apr 11): -15.2% — 11th largest
> Change in retail and recreation mobility: -32.5% — 10th largest decline
> Change in grocery and pharmacy mobility: -0.3% — the smallest decline
> Change in parks mobility: -0.3% — 9th largest decline
> Change in transit stations mobility: -38.5% — 16th largest decline
> Stay-at-home order effective date: Mar. 21
> 7-day increase in confirmed COVID-19 cases through Apr. 29: +37.0% — 9th highest
> Confirmed COVID-19 cases as of Apr. 29: 378 per 100,000 — 9th highest (total: 48,102)
> Population: 12,741,080
Indiana
> Avg. change in mobility (Mar 8 – Apr 11): -4.9% — 9th smallest
> Change in retail and recreation mobility: -27.3% — 25th smallest decline
> Change in grocery and pharmacy mobility: -2.3% — 6th smallest decline
> Change in parks mobility: +34.9% — 11th largest increase
> Change in transit stations mobility: -16.7% — 12th smallest decline
> Stay-at-home order effective date: Mar. 24
> 7-day increase in confirmed COVID-19 cases through Apr. 29: +33.4% — 14th highest
> Confirmed COVID-19 cases as of Apr. 29: 248 per 100,000 — 14th highest (total: 16,588)
> Population: 6,691,878

Iowa
> Avg. change in mobility (Mar 8 – Apr 11): -0.5% — the smallest
> Change in retail and recreation mobility: -27.9% — 25th largest decline
> Change in grocery and pharmacy mobility: +7.0% — the largest increase
> Change in parks mobility: +45.4% — 4th largest increase
> Change in transit stations mobility: -13.1% — 5th smallest decline
> Stay-at-home order effective date: No statewide stay-at-home order as of April 29
> 7-day increase in confirmed COVID-19 cases through Apr. 29: +70.1% — 2nd highest
> Confirmed COVID-19 cases as of Apr. 29: 202 per 100,000 — 17th highest (total: 6,376)
> Population: 3,156,145
Kansas
> Avg. change in mobility (Mar 8 – Apr 11): -1.0% — 2nd smallest
> Change in retail and recreation mobility: -24.9% — 15th smallest decline
> Change in grocery and pharmacy mobility: 0% — 17th largest increase
> Change in parks mobility: +47.8% — 2nd largest increase
> Change in transit stations mobility: -12.0% — 3rd smallest decline
> Stay-at-home order effective date: Mar. 30
> 7-day increase in confirmed COVID-19 cases through Apr. 29: +57.9% — 3rd highest
> Confirmed COVID-19 cases as of Apr. 29: 120 per 100,000 — 20th lowest (total: 3,491)
> Population: 2,911,510

Kentucky
> Avg. change in mobility (Mar 8 – Apr 11): -3.6% — 8th smallest
> Change in retail and recreation mobility: -24.7% — 13th smallest decline
> Change in grocery and pharmacy mobility: +2.9% — 9th largest increase
> Change in parks mobility: +38.6% — 6th largest increase
> Change in transit stations mobility: -20.1% — 16th smallest decline
> Stay-at-home order effective date: Mar. 26
> 7-day increase in confirmed COVID-19 cases through Apr. 29: +29.7% — 18th highest
> Confirmed COVID-19 cases as of Apr. 29: 98 per 100,000 — 13th lowest (total: 4,375)
> Population: 4,468,402

Louisiana
> Avg. change in mobility (Mar 8 – Apr 11): -13.1% — 15th largest
> Change in retail and recreation mobility: -27.0% — 24th smallest decline
> Change in grocery and pharmacy mobility: +0.8% — 16th largest increase
> Change in parks mobility: -6.2% — 8th largest decline
> Change in transit stations mobility: -29.4% — 23rd smallest decline
> Stay-at-home order effective date: Mar. 23
> 7-day increase in confirmed COVID-19 cases through Apr. 29: +8.0% — 5th lowest
> Confirmed COVID-19 cases as of Apr. 29: 586 per 100,000 — 6th highest (total: 27,286)
> Population: 4,659,978
Maine
> Avg. change in mobility (Mar 8 – Apr 11): -12.4% — 17th largest
> Change in retail and recreation mobility: -30.3% — 17th largest decline
> Change in grocery and pharmacy mobility: -5.3% — 16th smallest decline
> Change in parks mobility: 10.9% — 8th smallest increase
> Change in transit stations mobility: -32.8% — 21st largest decline
> Stay-at-home order effective date: Apr. 2
> 7-day increase in confirmed COVID-19 cases through Apr. 29: +14.7% — 10th lowest
> Confirmed COVID-19 cases as of Apr. 29: 78 per 100,000 — 8th lowest (total: 1,040)
> Population: 1,338,404
Maryland
> Avg. change in mobility (Mar 8 – Apr 11): -12.6% — 16th largest
> Change in retail and recreation mobility: -28.4% — 24th largest decline
> Change in grocery and pharmacy mobility: -9.3% — 5th largest decline
> Change in parks mobility: +22.3% — tied–18th largest increase
> Change in transit stations mobility: -40.0% — 11th largest decline
> Stay-at-home order effective date: Mar. 30
> 7-day increase in confirmed COVID-19 cases through Apr. 29: +36.1% — 10th highest
> Confirmed COVID-19 cases as of Apr. 29: 333 per 100,000 — 11th highest (total: 20,113)
> Population: 6,042,718

Massachusetts
> Avg. change in mobility (Mar 8 – Apr 11): -17.6% — 7th largest
> Change in retail and recreation mobility: -35.0% — 5th largest decline
> Change in grocery and pharmacy mobility: -8.5% — 6th largest decline
> Change in parks mobility: +13.1% — 10th smallest increase
> Change in transit stations mobility: -53.2% — the largest decline
> Stay-at-home order effective date: Mar. 24
> 7-day increase in confirmed COVID-19 cases through Apr. 29: +35.8% — 11th highest
> Confirmed COVID-19 cases as of Apr. 29: 845 per 100,000 — 3rd highest (total: 58,302)
> Population: 6,902,149

Michigan
> Avg. change in mobility (Mar 8 – Apr 11): -11.8% — 20th largest
> Change in retail and recreation mobility: -37.3% — 3rd largest decline
> Change in grocery and pharmacy mobility: -7.6% — 9th largest decline
> Change in parks mobility: +31.1% — 12th largest increase
> Change in transit stations mobility: -34.7% — 19th largest decline
> Stay-at-home order effective date: Mar. 24
> 7-day increase in confirmed COVID-19 cases through Apr. 29: +15.6% — 12th lowest
> Confirmed COVID-19 cases as of Apr. 29: 393 per 100,000 — 8th highest (total: 39,262)
> Population: 9,995,915

Minnesota
> Avg. change in mobility (Mar 8 – Apr 11): -12.3% — 18th largest
> Change in retail and recreation mobility: -31.5% — 13th largest decline
> Change in grocery and pharmacy mobility: -6.1% — 16th largest decline
> Change in parks mobility: +22.3% — tied–18th largest increase
> Change in transit stations mobility: -40.8% — 10th largest decline
> Stay-at-home order effective date: Mar. 27
> 7-day increase in confirmed COVID-19 cases through Apr. 29: +53.7% — 4th highest
> Confirmed COVID-19 cases as of Apr. 29: 75 per 100,000 — 7th lowest (total: 4,181)
> Population: 5,611,179

Mississippi
> Avg. change in mobility (Mar 8 – Apr 11): -5.1% — 11th smallest
> Change in retail and recreation mobility: -17.8% — the smallest decline
> Change in grocery and pharmacy mobility: +3.9% — 3rd largest increase
> Change in parks mobility: +13.3% — 11th smallest increase
> Change in transit stations mobility: -13.2% — 6th smallest decline
> Stay-at-home order effective date: Apr. 3
> 7-day increase in confirmed COVID-19 cases through Apr. 29: +29.6% — 19th highest
> Confirmed COVID-19 cases as of Apr. 29: 212 per 100,000 — 16th highest (total: 6,342)
> Population: 2,986,530
Missouri
> Avg. change in mobility (Mar 8 – Apr 11): -5.6% — 13th smallest
> Change in retail and recreation mobility: -24.2% — 9th smallest decline
> Change in grocery and pharmacy mobility: +2.9% — 9th largest increase
> Change in parks mobility: +25.1% — 14th largest increase
> Change in transit stations mobility: -21.3% — 20th smallest decline
> Stay-at-home order effective date: Apr. 6
> 7-day increase in confirmed COVID-19 cases through Apr. 29: +19.0% — 20th lowest
> Confirmed COVID-19 cases as of Apr. 29: 119 per 100,000 — 19th lowest (total: 7,303)
> Population: 6,126,452
Montana
> Avg. change in mobility (Mar 8 – Apr 11): -9.7% — 24th smallest
> Change in retail and recreation mobility: -29.0% — 23rd largest decline
> Change in grocery and pharmacy mobility: -2.3% — 5th smallest decline
> Change in parks mobility: 11.2% — 9th smallest increase
> Change in transit stations mobility: -20.4% — 17th smallest decline
> Stay-at-home order effective date: Mar. 28
> 7-day increase in confirmed COVID-19 cases through Apr. 29: +2.7% — 2nd lowest
> Confirmed COVID-19 cases as of Apr. 29: 42 per 100,000 — the lowest (total: 451)
> Population: 1,062,305

Nebraska
> Avg. change in mobility (Mar 8 – Apr 11): -2.5% — 5th smallest
> Change in retail and recreation mobility: -24.9% — 14th smallest decline
> Change in grocery and pharmacy mobility: +1.4% — 15th largest increase
> Change in parks mobility: +35.0% — 10th largest increase
> Change in transit stations mobility: -12.6% — 4th smallest decline
> Stay-at-home order effective date: No statewide stay-at-home order as of April 29
> 7-day increase in confirmed COVID-19 cases through Apr. 29: +86.1% — the highest
> Confirmed COVID-19 cases as of Apr. 29: 175 per 100,000 — 20th highest (total: 3,374)
> Population: 1,929,268

Nevada
> Avg. change in mobility (Mar 8 – Apr 11): -21.6% — 4th largest
> Change in retail and recreation mobility: -30.2% — 18th largest decline
> Change in grocery and pharmacy mobility: -5.1% — 14th smallest decline
> Change in parks mobility: -29.1% — 2nd largest decline
> Change in transit stations mobility: -41.1% — 9th largest decline
> Stay-at-home order effective date: Apr. 1
> 7-day increase in confirmed COVID-19 cases through Apr. 29: +18.1% — 17th lowest
> Confirmed COVID-19 cases as of Apr. 29: 159 per 100,000 — 21st highest (total: 4,821)
> Population: 3,034,392
New Hampshire
> Avg. change in mobility (Mar 8 – Apr 11): -11.3% — 23rd largest
> Change in retail and recreation mobility: -29.0% — 22nd largest decline
> Change in grocery and pharmacy mobility: -3.8% — 9th smallest decline
> Change in parks mobility: +13.5% — 12th smallest increase
> Change in transit stations mobility: -31.7% — 22nd largest decline
> Stay-at-home order effective date: Mar. 27
> 7-day increase in confirmed COVID-19 cases through Apr. 29: +26.6% — 22nd highest
> Confirmed COVID-19 cases as of Apr. 29: 148 per 100,000 — 24th highest (total: 2,010)
> Population: 1,356,458
New Jersey
> Avg. change in mobility (Mar 8 – Apr 11): -16.3% — 8th largest
> Change in retail and recreation mobility: -38.2% — 2nd largest decline
> Change in grocery and pharmacy mobility: -6.1% — 15th largest decline
> Change in parks mobility: +17.8% — 18th smallest increase
> Change in transit stations mobility: -49.7% — 3rd largest decline
> Stay-at-home order effective date: Mar. 21
> 7-day increase in confirmed COVID-19 cases through Apr. 29: +18.8% — 19th lowest
> Confirmed COVID-19 cases as of Apr. 29: 1,278 per 100,000 — 2nd highest (total: 113,856)
> Population: 8,908,520

New Mexico
> Avg. change in mobility (Mar 8 – Apr 11): -9.1% — 21st smallest
> Change in retail and recreation mobility: -24.9% — 17th smallest decline
> Change in grocery and pharmacy mobility: +2.9% — 10th largest increase
> Change in parks mobility: +1.5% — 2nd smallest increase
> Change in transit stations mobility: -15.3% — 9th smallest decline
> Stay-at-home order effective date: Mar. 24
> 7-day increase in confirmed COVID-19 cases through Apr. 29: +34.6% — 13th highest
> Confirmed COVID-19 cases as of Apr. 29: 142 per 100,000 — 25th lowest (total: 2,974)
> Population: 2,095,428

New York
> Avg. change in mobility (Mar 8 – Apr 11): -22.1% — 2nd largest
> Change in retail and recreation mobility: -40.6% — the largest decline
> Change in grocery and pharmacy mobility: -7.1% — 11th largest decline
> Change in parks mobility: -11.5% — 6th largest decline
> Change in transit stations mobility: -50.9% — 2nd largest decline
> Stay-at-home order effective date: Mar. 22
> 7-day increase in confirmed COVID-19 cases through Apr. 29: +14.7% — 10th lowest
> Confirmed COVID-19 cases as of Apr. 29: 1,510 per 100,000 — the highest (total: 295,106)
> Population: 19,542,209
North Carolina
> Avg. change in mobility (Mar 8 – Apr 11): -8.6% — 20th smallest
> Change in retail and recreation mobility: -24.2% — 10th smallest decline
> Change in grocery and pharmacy mobility: -0.5% — 2nd smallest decline
> Change in parks mobility: 22.0% — 20th largest increase
> Change in transit stations mobility: -31.6% — 23rd largest decline
> Stay-at-home order effective date: Mar. 30
> 7-day increase in confirmed COVID-19 cases through Apr. 29: +32.5% — 15th highest
> Confirmed COVID-19 cases as of Apr. 29: 92 per 100,000 — 11th lowest (total: 9,568)
> Population: 10,383,620
North Dakota
> Avg. change in mobility (Mar 8 – Apr 11): -9.7% — 24th smallest
> Change in retail and recreation mobility: -29.6% — 20th largest decline
> Change in grocery and pharmacy mobility: -0.9% — 4th smallest decline
> Change in parks mobility: +3.5% — 3rd smallest increase
> Change in transit stations mobility: -20.5% — 18th smallest decline
> Stay-at-home order effective date: No statewide stay-at-home order as of April 29
> 7-day increase in confirmed COVID-19 cases through Apr. 29: +45.9% — 5th highest
> Confirmed COVID-19 cases as of Apr. 29: 130 per 100,000 — 21st lowest (total: 991)
> Population: 760,077

Ohio
> Avg. change in mobility (Mar 8 – Apr 11): -3.4% — 7th smallest
> Change in retail and recreation mobility: -29.2% — 21st largest decline
> Change in grocery and pharmacy mobility: -2.9% — 7th smallest decline
> Change in parks mobility: +50.8% — the largest increase
> Change in transit stations mobility: -20.0% — 15th smallest decline
> Stay-at-home order effective date: Mar. 23
> 7-day increase in confirmed COVID-19 cases through Apr. 29: +18.8% — 19th lowest
> Confirmed COVID-19 cases as of Apr. 29: 143 per 100,000 — 25th highest (total: 16,769)
> Population: 11,689,442

Oklahoma
> Avg. change in mobility (Mar 8 – Apr 11): -5.1% — 10th smallest
> Change in retail and recreation mobility: -21.0% — 3rd smallest decline
> Change in grocery and pharmacy mobility: +2.2% — 13th largest increase
> Change in parks mobility: +16.1% — 15th smallest increase
> Change in transit stations mobility: -11.2% — 2nd smallest decline
> Stay-at-home order effective date: No statewide stay-at-home order as of April 29
> 7-day increase in confirmed COVID-19 cases through Apr. 29: +17.8% — 16th lowest
> Confirmed COVID-19 cases as of Apr. 29: 86 per 100,000 — 9th lowest (total: 3,410)
> Population: 3,943,079
Oregon
> Avg. change in mobility (Mar 8 – Apr 11): -11.0% — 24th largest
> Change in retail and recreation mobility: -30.5% — 16th largest decline
> Change in grocery and pharmacy mobility: -5.5% — 17th largest decline
> Change in parks mobility: +21.7% — 21st smallest increase
> Change in transit stations mobility: -31.3% — 24th largest decline
> Stay-at-home order effective date: Mar. 23
> 7-day increase in confirmed COVID-19 cases through Apr. 29: +15.8% — 13th lowest
> Confirmed COVID-19 cases as of Apr. 29: 57 per 100,000 — 4th lowest (total: 2,385)
> Population: 4,190,713
Pennsylvania
> Avg. change in mobility (Mar 8 – Apr 11): -14.2% — 13th largest
> Change in retail and recreation mobility: -32.8% — 9th largest decline
> Change in grocery and pharmacy mobility: -9.5% — 4th largest decline
> Change in parks mobility: +16.7% — 16th smallest increase
> Change in transit stations mobility: -39.0% — 15th largest decline
> Stay-at-home order effective date: Apr. 1
> 7-day increase in confirmed COVID-19 cases through Apr. 29: +21.2% — 23rd lowest
> Confirmed COVID-19 cases as of Apr. 29: 338 per 100,000 — 10th highest (total: 43,264)
> Population: 12,807,060

Rhode Island
> Avg. change in mobility (Mar 8 – Apr 11): -9.6% — 22nd smallest
> Change in retail and recreation mobility: -30.9% — 15th largest decline
> Change in grocery and pharmacy mobility: -6.3% — 13th largest decline
> Change in parks mobility: +42.6% — 5th largest increase
> Change in transit stations mobility: -45.1% — 5th largest decline
> Stay-at-home order effective date: Mar. 28
> 7-day increase in confirmed COVID-19 cases through Apr. 29: +35.7% — 12th highest
> Confirmed COVID-19 cases as of Apr. 29: 750 per 100,000 — 4th highest (total: 7,926)
> Population: 1,057,315
South Carolina
> Avg. change in mobility (Mar 8 – Apr 11): -8.3% — 19th smallest
> Change in retail and recreation mobility: -22.3% — 5th smallest decline
> Change in grocery and pharmacy mobility: +1.6% — 14th largest increase
> Change in parks mobility: +3.6% — 4th smallest increase
> Change in transit stations mobility: -17.0% — 13th smallest decline
> Stay-at-home order effective date: Apr.7
> 7-day increase in confirmed COVID-19 cases through Apr. 29: +20.5% — 22nd lowest
> Confirmed COVID-19 cases as of Apr. 29: 113 per 100,000 — 17th lowest (total: 5,735)
> Population: 5,084,127
South Dakota
> Avg. change in mobility (Mar 8 – Apr 11): -3.0% — 6th smallest
> Change in retail and recreation mobility: -24.7% — 12th smallest decline
> Change in grocery and pharmacy mobility: +5.5% — 2nd largest increase
> Change in parks mobility: 28.3% — 13th largest increase
> Change in transit stations mobility: -16.0% — 10th smallest decline
> Stay-at-home order effective date: No statewide stay-at-home order as of April 29
> 7-day increase in confirmed COVID-19 cases through Apr. 29: +24.5% — 25th highest
> Confirmed COVID-19 cases as of Apr. 29: 262 per 100,000 — 12th highest (total: 2,313)
> Population: 882,235
Tennessee
> Avg. change in mobility (Mar 8 – Apr 11): -7.2% — 16th smallest
> Change in retail and recreation mobility: -23.5% — 7th smallest decline
> Change in grocery and pharmacy mobility: 2.4% — 12th largest increase
> Change in parks mobility: +15.7% — 14th smallest increase
> Change in transit stations mobility: -21.0% — 19th smallest decline
> Stay-at-home order effective date: Mar. 31
> 7-day increase in confirmed COVID-19 cases through Apr. 29: +28.2% — 20th highest
> Confirmed COVID-19 cases as of Apr. 29: 148 per 100,000 — 23rd highest (total: 10,052)
> Population: 6,770,010

Texas
> Avg. change in mobility (Mar 8 – Apr 11): -15.4% — 10th largest
> Change in retail and recreation mobility: -26.7% — 22nd smallest decline
> Change in grocery and pharmacy mobility: -3.9% — 10th smallest decline
> Change in parks mobility: -13.5% — 5th largest decline
> Change in transit stations mobility: -29.5% — 24th smallest decline
> Stay-at-home order effective date: Apr. 2
> 7-day increase in confirmed COVID-19 cases through Apr. 29: +24.2% — 25th lowest
> Confirmed COVID-19 cases as of Apr. 29: 91 per 100,000 — 10th lowest (total: 26,171)
> Population: 28,701,845
Utah
> Avg. change in mobility (Mar 8 – Apr 11): -6.3% — 15th smallest
> Change in retail and recreation mobility: -26.0% — 20th smallest decline
> Change in grocery and pharmacy mobility: +3.6% — 5th largest increase
> Change in parks mobility: 35.1% — 8th largest increase
> Change in transit stations mobility: -30.8% — 25th largest decline
> Stay-at-home order effective date: No statewide stay-at-home order as of April 29
> 7-day increase in confirmed COVID-19 cases through Apr. 29: +26.1% — 23rd highest
> Confirmed COVID-19 cases as of Apr. 29: 137 per 100,000 — 23rd lowest (total: 4,343)
> Population: 3,161,105
Vermont
> Avg. change in mobility (Mar 8 – Apr 11): -18.3% — 6th largest
> Change in retail and recreation mobility: -35.7% — 4th largest decline
> Change in grocery and pharmacy mobility: -15.1% — 2nd largest decline
> Change in parks mobility: +1.3% — the smallest increase
> Change in transit stations mobility: -39.6% — 13th largest decline
> Stay-at-home order effective date: Mar. 24
> 7-day increase in confirmed COVID-19 cases through Apr. 29: +1.3% — the lowest
> Confirmed COVID-19 cases as of Apr. 29: 133 per 100,000 — 22nd lowest (total: 834)
> Population: 626,299
Virginia
> Avg. change in mobility (Mar 8 – Apr 11): -10.3% — 25th largest
> Change in retail and recreation mobility: -26.0% — 21st smallest decline
> Change in grocery and pharmacy mobility: -4.0% — 11th smallest decline
> Change in parks mobility: +23.0% — 16th largest increase
> Change in transit stations mobility: -35.9% — 17th largest decline
> Stay-at-home order effective date: Mar. 30
> 7-day increase in confirmed COVID-19 cases through Apr. 29: +45.7% — 6th highest
> Confirmed COVID-19 cases as of Apr. 29: 176 per 100,000 — 19th highest (total: 14,961)
> Population: 8,517,685
Washington
> Avg. change in mobility (Mar 8 – Apr 11): -14.1% — 14th largest
> Change in retail and recreation mobility: -32.1% — 11th largest decline
> Change in grocery and pharmacy mobility: -7.2% — 10th largest decline
> Change in parks mobility: +22.9% — 17th largest increase
> Change in transit stations mobility: -43.6% — 6th largest decline
> Stay-at-home order effective date: Mar. 23
> 7-day increase in confirmed COVID-19 cases through Apr. 29: +10.8% — 7th lowest
> Confirmed COVID-19 cases as of Apr. 29: 184 per 100,000 — 18th highest (total: 13,842)
> Population: 7,535,591
West Virginia
> Avg. change in mobility (Mar 8 – Apr 11): -8.0% — 18th smallest
> Change in retail and recreation mobility: -24.1% — 8th smallest decline
> Change in grocery and pharmacy mobility: -3.4% — 8th smallest decline
> Change in parks mobility: 14.3% — 13th smallest increase
> Change in transit stations mobility: -17.5% — 14th smallest decline
> Stay-at-home order effective date: Mar. 24
> 7-day increase in confirmed COVID-19 cases through Apr. 29: +13.7% — 8th lowest
> Confirmed COVID-19 cases as of Apr. 29: 61 per 100,000 — 5th lowest (total: 1,095)
> Population: 1,805,832

Wisconsin
> Avg. change in mobility (Mar 8 – Apr 11): -7.5% — 17th smallest
> Change in retail and recreation mobility: -33.1% — 8th largest decline
> Change in grocery and pharmacy mobility: -6.6% — 12th largest decline
> Change in parks mobility: 35.1% — 9th largest increase
> Change in transit stations mobility: -25.2% — 21st smallest decline
> Stay-at-home order effective date: Mar. 25
> 7-day increase in confirmed COVID-19 cases through Apr. 29: +29.8% — 17th highest
> Confirmed COVID-19 cases as of Apr. 29: 108 per 100,000 — 15th lowest (total: 6,289)
> Population: 5,813,568

Wyoming
> Avg. change in mobility (Mar 8 – Apr 11): -5.7% — 14th smallest
> Change in retail and recreation mobility: -24.3% — 11th smallest decline
> Change in grocery and pharmacy mobility: +3.5% — 6th largest increase
> Change in parks mobility: 7.7% — 6th smallest increase
> Change in transit stations mobility: -6.4% — the smallest decline
> Stay-at-home order effective date: No statewide stay-at-home order as of April 29
> 7-day increase in confirmed COVID-19 cases through Apr. 29: +19.3% — 21st lowest
> Confirmed COVID-19 cases as of Apr. 29: 67 per 100,000 — 6th lowest (total: 389)
> Population: 577,737