Though alcohol is enjoyed responsibly by millions of Americans every day, it is also misused by many — and overconsumption can have serious consequences. Excessive drinking is the third leading cause of preventable death in the United States.
Excessive drinking can lead to a variety of health problems and significantly shorten a person’s life. The habit claimed over 140,000 lives each year between 2015 and 2019, according to the Centers for Disease Control and Prevention. That is more than 380 deaths a day. And those who die as the result of excessive drinking die 26 years prematurely, on average. (These are the 50 U.S. counties where people have the shortest life expectancy.)
To identify the states with the highest excessive drinking rates, 24/7 Tempo reviewed the percentage of adults 18 and older who report binge or heavy drinking within a 30-day period across the country. Data came from the 2022 County Health Rankings & Roadmaps, a Robert Wood Johnson Foundation and University of Wisconsin Population Health Institute joint program.
Excessive drinking includes both binge and heavy drinking. Heavy drinking is defined as consuming at least 15 drinks a week or averaging two or more drinks a day for men, according to the CDC. For women, it’s eight drinks or more per week or more than one drink on average a day. Binge drinking is defined as a pattern of alcohol consumption that brings a person’s blood alcohol concentration level to 0.08% or higher — estimated to take about five or more drinks within two hours for men and four or more drinks for women.
Excessive alcohol consumption rates appear associated with some economic factors. Alcohol can be expensive, and people’s ability to drink to excess can be limited by their income. States with higher excessive drinking rates tend to have higher incomes, and vice-versa.
Fatal car accidents that involve alcohol appear to be more common in the states with higher excessive drinking rates. Nationwide, 26.6% of all driving deaths involve alcohol. In the 20 states with the highest excessive drinking rates, the share is higher than the national rate.

50. Utah
> Adults who drink excessively: 11.9% (US rate: 19.8%)
> Fatal car accidents involving alcohol: 21.7% — 6th lowest (US rate: 26.6%)
> Median household income: $75,780 — 11th highest (US median: $65,712)
> Population: 3,205,958

49. Oklahoma
> Adults who drink excessively: 14.5% (US rate: 19.8%)
> Fatal car accidents involving alcohol: 26.8% — 20th lowest (US rate: 26.6%)
> Median household income: $54,449 — 8th lowest (US median: $65,712)
> Population: 3,956,971

48. Alabama
> Adults who drink excessively: 14.8% (US rate: 19.8%)
> Fatal car accidents involving alcohol: 25.9% — 17th lowest (US rate: 26.6%)
> Median household income: $51,734 — 5th lowest (US median: $65,712)
> Population: 4,903,185

47. West Virginia
> Adults who drink excessively: 15.2% (US rate: 19.8%)
> Fatal car accidents involving alcohol: 26.1% — 18th lowest (US rate: 26.6%)
> Median household income: $48,850 — 2nd lowest (US median: $65,712)
> Population: 1,792,147

46. Mississippi
> Adults who drink excessively: 15.9% (US rate: 19.8%)
> Fatal car accidents involving alcohol: 18.5% — the lowest (US rate: 26.6%)
> Median household income: $45,792 — the lowest (US median: $65,712)
> Population: 2,976,149

45. Arkansas
> Adults who drink excessively: 15.9% (US rate: 19.8%)
> Fatal car accidents involving alcohol: 25.7% — 15th lowest (US rate: 26.6%)
> Median household income: $48,952 — 3rd lowest (US median: $65,712)
> Population: 3,017,804
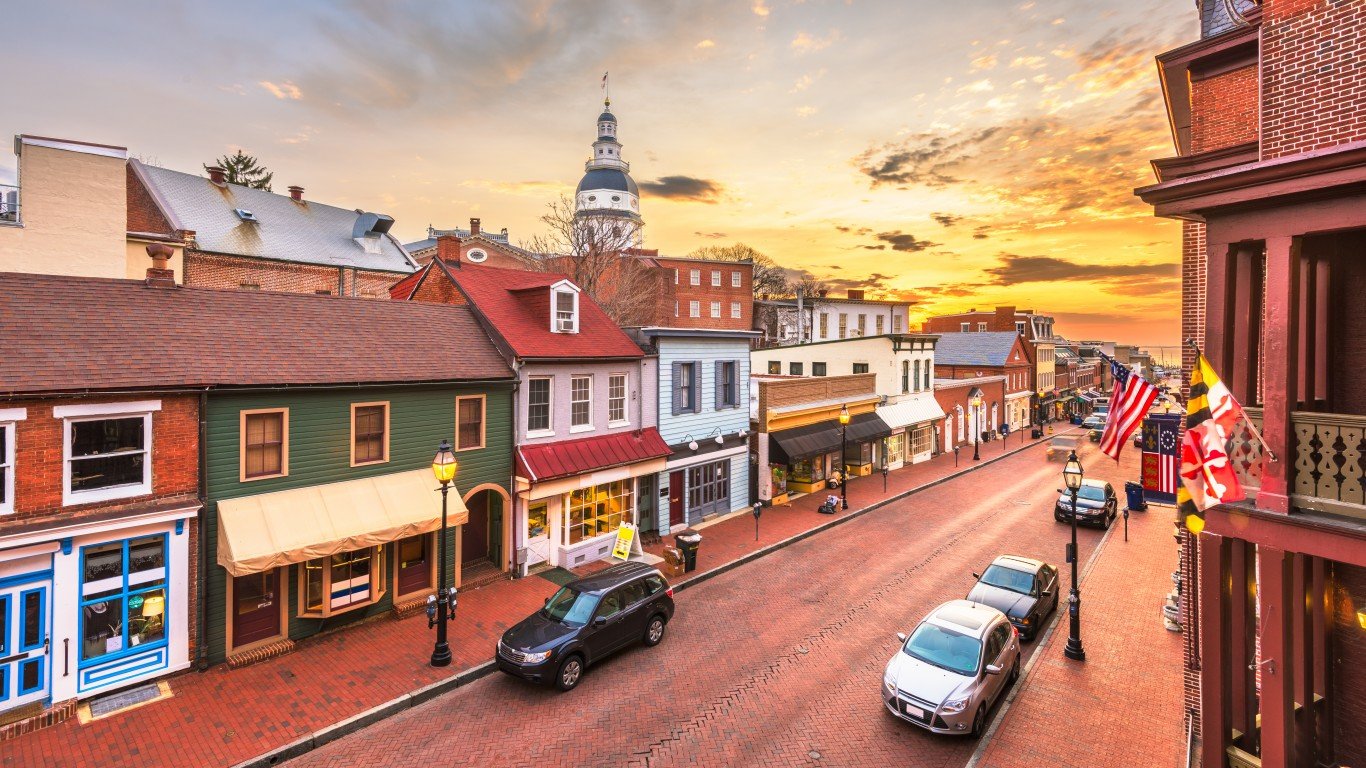
44. Maryland
> Adults who drink excessively: 16.0% (US rate: 19.8%)
> Fatal car accidents involving alcohol: 28.3% — 25th lowest (US rate: 26.6%)
> Median household income: $86,738 — the highest (US median: $65,712)
> Population: 6,045,680

43. New Jersey
> Adults who drink excessively: 16.0% (US rate: 19.8%)
> Fatal car accidents involving alcohol: 22.8% — 9th lowest (US rate: 26.6%)
> Median household income: $85,751 — 3rd highest (US median: $65,712)
> Population: 8,882,190

42. Washington
> Adults who drink excessively: 16.5% (US rate: 19.8%)
> Fatal car accidents involving alcohol: 32.7% — 13th highest (US rate: 26.6%)
> Median household income: $78,687 — 7th highest (US median: $65,712)
> Population: 7,614,893

41. North Carolina
> Adults who drink excessively: 16.5% (US rate: 19.8%)
> Fatal car accidents involving alcohol: 25.9% — 16th lowest (US rate: 26.6%)
> Median household income: $57,341 — 12th lowest (US median: $65,712)
> Population: 10,488,084

40. Tennessee
> Adults who drink excessively: 17.2% (US rate: 19.8%)
> Fatal car accidents involving alcohol: 23.5% — 10th lowest (US rate: 26.6%)
> Median household income: $56,071 — 9th lowest (US median: $65,712)
> Population: 6,829,174

39. Virginia
> Adults who drink excessively: 17.3% (US rate: 19.8%)
> Fatal car accidents involving alcohol: 30.3% — 21st highest (US rate: 26.6%)
> Median household income: $76,456 — 10th highest (US median: $65,712)
> Population: 8,535,519

38. Arizona
> Adults who drink excessively: 17.4% (US rate: 19.8%)
> Fatal car accidents involving alcohol: 22.3% — 8th lowest (US rate: 26.6%)
> Median household income: $62,055 — 23rd lowest (US median: $65,712)
> Population: 7,278,717

37. New Mexico
> Adults who drink excessively: 17.4% (US rate: 19.8%)
> Fatal car accidents involving alcohol: 29.4% — 23rd highest (US rate: 26.6%)
> Median household income: $51,945 — 6th lowest (US median: $65,712)
> Population: 2,096,829

36. Indiana
> Adults who drink excessively: 17.7% (US rate: 19.8%)
> Fatal car accidents involving alcohol: 19.0% — 2nd lowest (US rate: 26.6%)
> Median household income: $57,603 — 14th lowest (US median: $65,712)
> Population: 6,732,219

35. Georgia
> Adults who drink excessively: 17.8% (US rate: 19.8%)
> Fatal car accidents involving alcohol: 20.7% — 5th lowest (US rate: 26.6%)
> Median household income: $61,980 — 22nd lowest (US median: $65,712)
> Population: 10,617,423

34. Alaska
> Adults who drink excessively: 18.1% (US rate: 19.8%)
> Fatal car accidents involving alcohol: 36.9% — 4th highest (US rate: 26.6%)
> Median household income: $75,463 — 12th highest (US median: $65,712)
> Population: 731,545

33. Kentucky
> Adults who drink excessively: 18.2% (US rate: 19.8%)
> Fatal car accidents involving alcohol: 25.5% — 14th lowest (US rate: 26.6%)
> Median household income: $52,295 — 7th lowest (US median: $65,712)
> Population: 4,467,673

32. California
> Adults who drink excessively: 18.8% (US rate: 19.8%)
> Fatal car accidents involving alcohol: 27.7% — 23rd lowest (US rate: 26.6%)
> Median household income: $80,440 — 5th highest (US median: $65,712)
> Population: 39,512,223

31. New York
> Adults who drink excessively: 19.0% (US rate: 19.8%)
> Fatal car accidents involving alcohol: 20.2% — 4th lowest (US rate: 26.6%)
> Median household income: $72,108 — 14th highest (US median: $65,712)
> Population: 19,453,561

30. Connecticut
> Adults who drink excessively: 19.2% (US rate: 19.8%)
> Fatal car accidents involving alcohol: 30.4% — 20th highest (US rate: 26.6%)
> Median household income: $78,833 — 6th highest (US median: $65,712)
> Population: 3,565,287

29. Missouri
> Adults who drink excessively: 19.5% (US rate: 19.8%)
> Fatal car accidents involving alcohol: 27.6% — 22nd lowest (US rate: 26.6%)
> Median household income: $57,409 — 13th lowest (US median: $65,712)
> Population: 6,137,428

28. Nevada
> Adults who drink excessively: 19.5% (US rate: 19.8%)
> Fatal car accidents involving alcohol: 27.3% — 21st lowest (US rate: 26.6%)
> Median household income: $63,276 — 24th highest (US median: $65,712)
> Population: 3,080,156
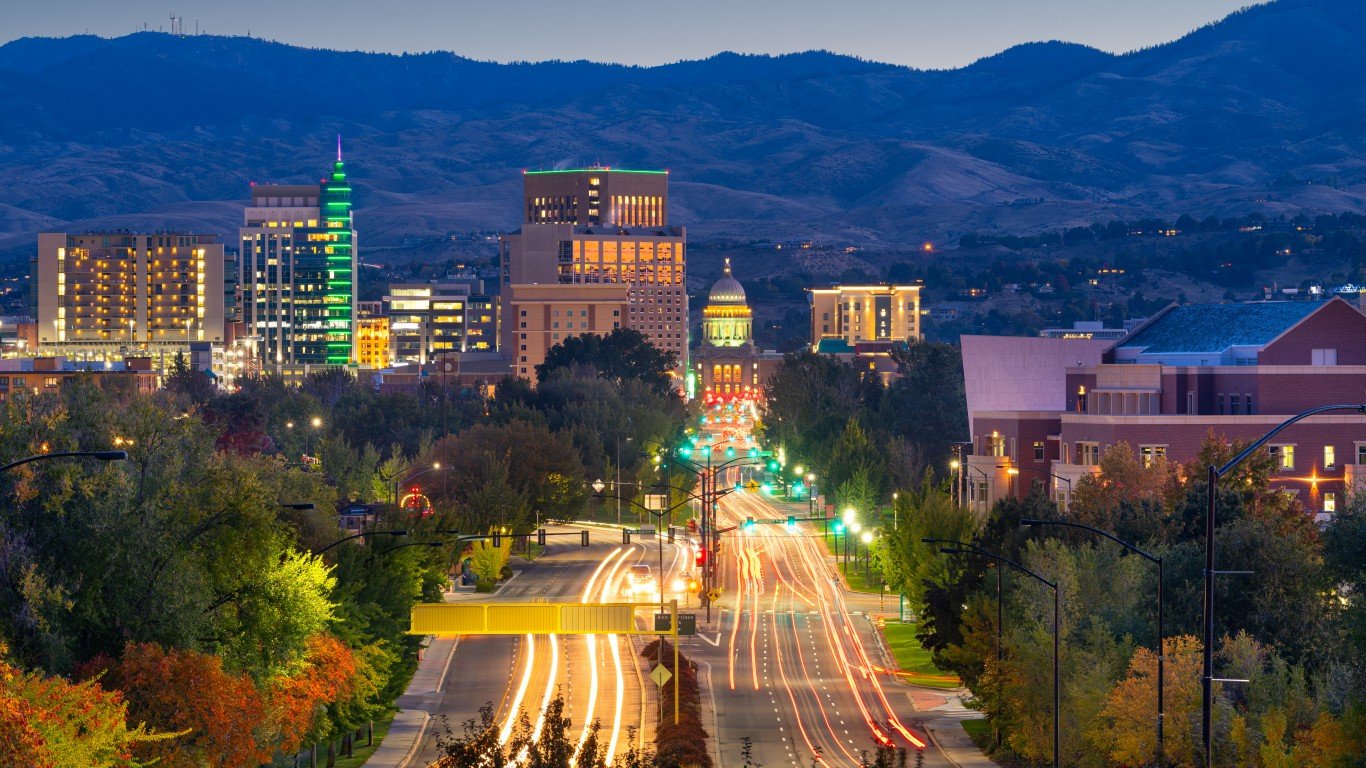
27. Idaho
> Adults who drink excessively: 19.6% (US rate: 19.8%)
> Fatal car accidents involving alcohol: 31.1% — 18th highest (US rate: 26.6%)
> Median household income: $60,999 — 20th lowest (US median: $65,712)
> Population: 1,787,065

26. Texas
> Adults who drink excessively: 19.6% (US rate: 19.8%)
> Fatal car accidents involving alcohol: 25.4% — 13th lowest (US rate: 26.6%)
> Median household income: $64,034 — 22nd highest (US median: $65,712)
> Population: 28,995,881

25. Pennsylvania
> Adults who drink excessively: 19.8% (US rate: 19.8%)
> Fatal car accidents involving alcohol: 25.4% — 12th lowest (US rate: 26.6%)
> Median household income: $63,463 — 23rd highest (US median: $65,712)
> Population: 12,801,989
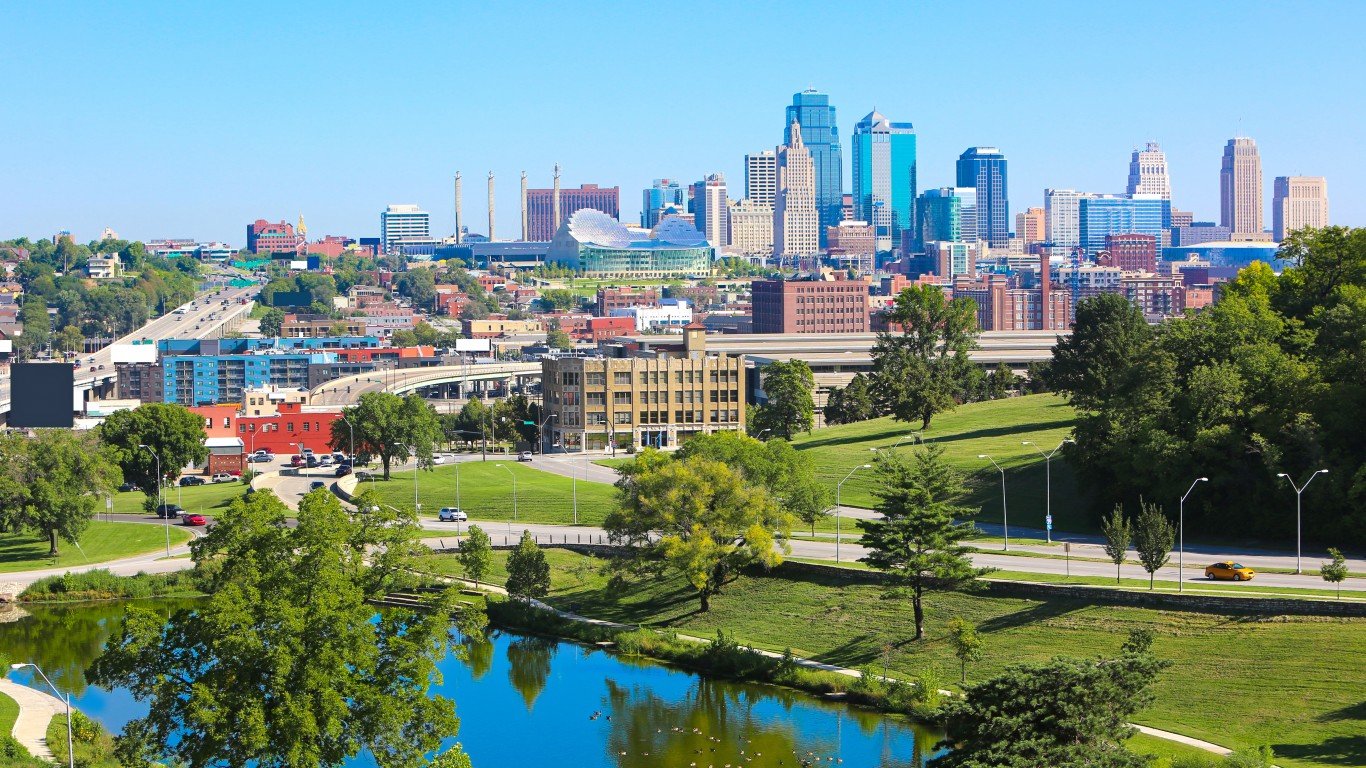
24. Kansas
> Adults who drink excessively: 20.0% (US rate: 19.8%)
> Fatal car accidents involving alcohol: 19.4% — 3rd lowest (US rate: 26.6%)
> Median household income: $62,087 — 24th lowest (US median: $65,712)
> Population: 2,913,314

23. Colorado
> Adults who drink excessively: 20.1% (US rate: 19.8%)
> Fatal car accidents involving alcohol: 34.0% — 9th highest (US rate: 26.6%)
> Median household income: $77,127 — 9th highest (US median: $65,712)
> Population: 5,758,736

22. Florida
> Adults who drink excessively: 20.2% (US rate: 19.8%)
> Fatal car accidents involving alcohol: 22.0% — 7th lowest (US rate: 26.6%)
> Median household income: $59,227 — 17th lowest (US median: $65,712)
> Population: 21,477,737

21. Delaware
> Adults who drink excessively: 20.5% (US rate: 19.8%)
> Fatal car accidents involving alcohol: 25.0% — 11th lowest (US rate: 26.6%)
> Median household income: $70,176 — 16th highest (US median: $65,712)
> Population: 973,764
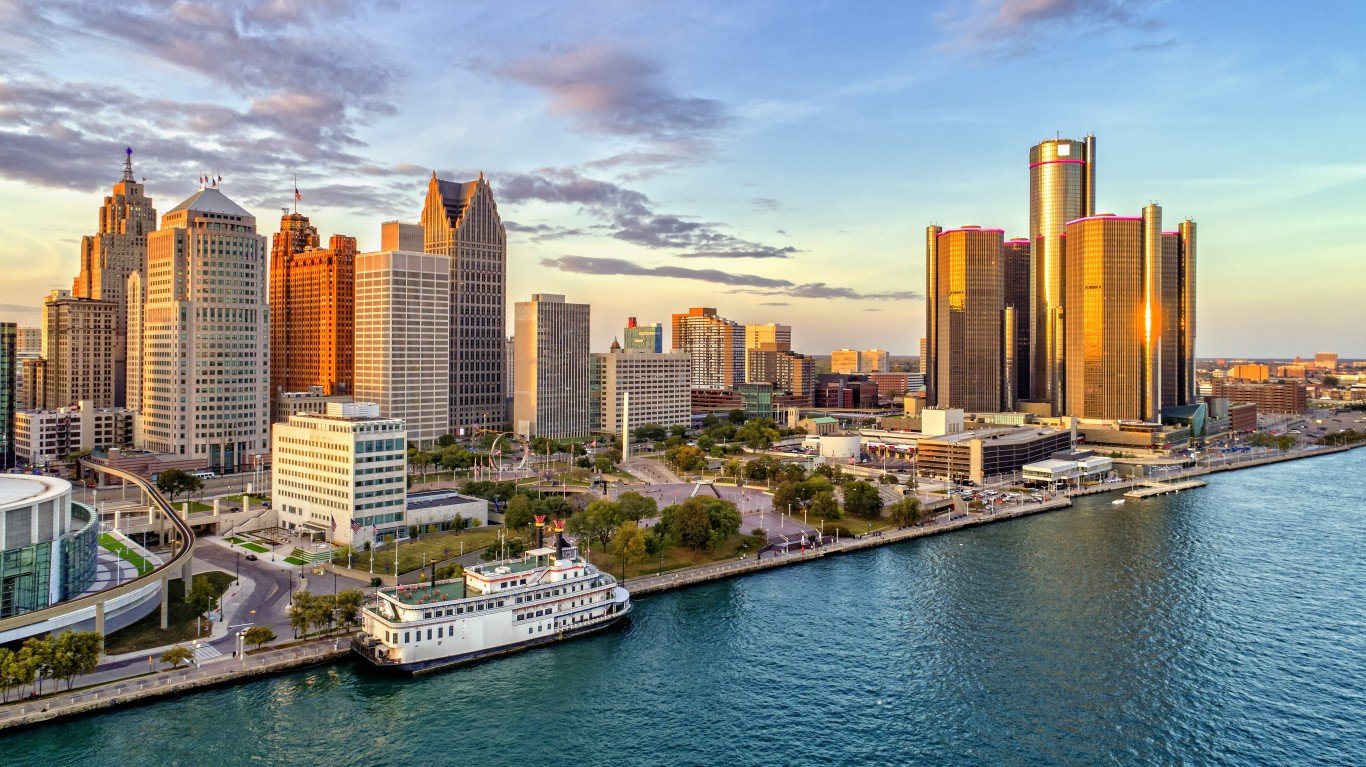
20. Michigan
> Adults who drink excessively: 20.5% (US rate: 19.8%)
> Fatal car accidents involving alcohol: 29.2% — 24th highest (US rate: 26.6%)
> Median household income: $59,584 — 19th lowest (US median: $65,712)
> Population: 9,986,857
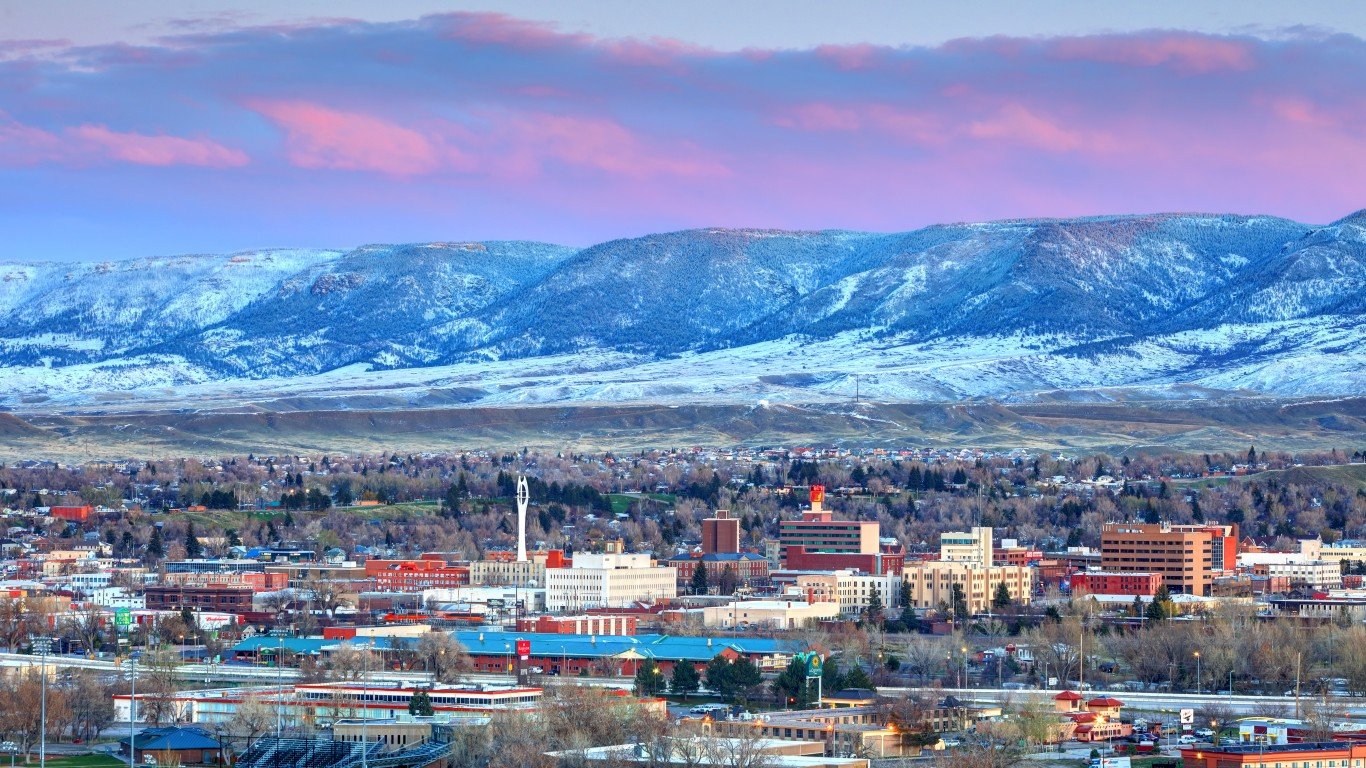
19. Wyoming
> Adults who drink excessively: 20.5% (US rate: 19.8%)
> Fatal car accidents involving alcohol: 31.8% — 15th highest (US rate: 26.6%)
> Median household income: $65,003 — 19th highest (US median: $65,712)
> Population: 578,759

18. Hawaii
> Adults who drink excessively: 20.7% (US rate: 19.8%)
> Fatal car accidents involving alcohol: 31.5% — 16th highest (US rate: 26.6%)
> Median household income: $83,102 — 4th highest (US median: $65,712)
> Population: 1,415,872

17. Ohio
> Adults who drink excessively: 20.7% (US rate: 19.8%)
> Fatal car accidents involving alcohol: 32.5% — 14th highest (US rate: 26.6%)
> Median household income: $58,642 — 15th lowest (US median: $65,712)
> Population: 11,689,100

16. New Hampshire
> Adults who drink excessively: 20.8% (US rate: 19.8%)
> Fatal car accidents involving alcohol: 33.1% — 11th highest (US rate: 26.6%)
> Median household income: $77,933 — 8th highest (US median: $65,712)
> Population: 1,359,711

15. Oregon
> Adults who drink excessively: 21.2% (US rate: 19.8%)
> Fatal car accidents involving alcohol: 27.9% — 24th lowest (US rate: 26.6%)
> Median household income: $67,058 — 18th highest (US median: $65,712)
> Population: 4,217,737

14. Rhode Island
> Adults who drink excessively: 21.7% (US rate: 19.8%)
> Fatal car accidents involving alcohol: 40.3% — 3rd highest (US rate: 26.6%)
> Median household income: $71,169 — 15th highest (US median: $65,712)
> Population: 1,059,361
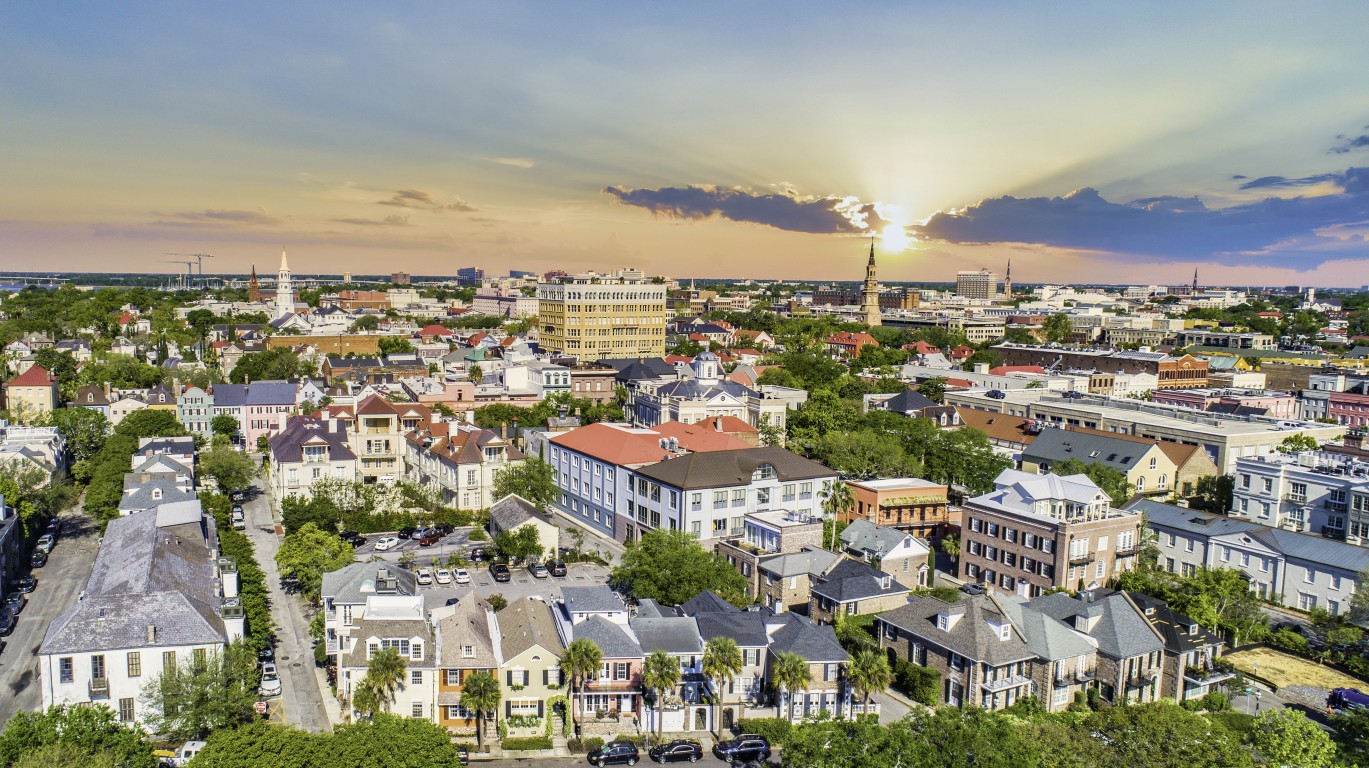
13. South Carolina
> Adults who drink excessively: 21.7% (US rate: 19.8%)
> Fatal car accidents involving alcohol: 32.8% — 12th highest (US rate: 26.6%)
> Median household income: $56,227 — 10th lowest (US median: $65,712)
> Population: 5,148,714

12. Louisiana
> Adults who drink excessively: 21.9% (US rate: 19.8%)
> Fatal car accidents involving alcohol: 31.2% — 17th highest (US rate: 26.6%)
> Median household income: $51,073 — 4th lowest (US median: $65,712)
> Population: 4,648,794

11. Maine
> Adults who drink excessively: 22.5% (US rate: 19.8%)
> Fatal car accidents involving alcohol: 34.4% — 8th highest (US rate: 26.6%)
> Median household income: $58,924 — 16th lowest (US median: $65,712)
> Population: 1,344,212

10. Massachusetts
> Adults who drink excessively: 22.5% (US rate: 19.8%)
> Fatal car accidents involving alcohol: 30.5% — 19th highest (US rate: 26.6%)
> Median household income: $85,843 — 2nd highest (US median: $65,712)
> Population: 6,892,503
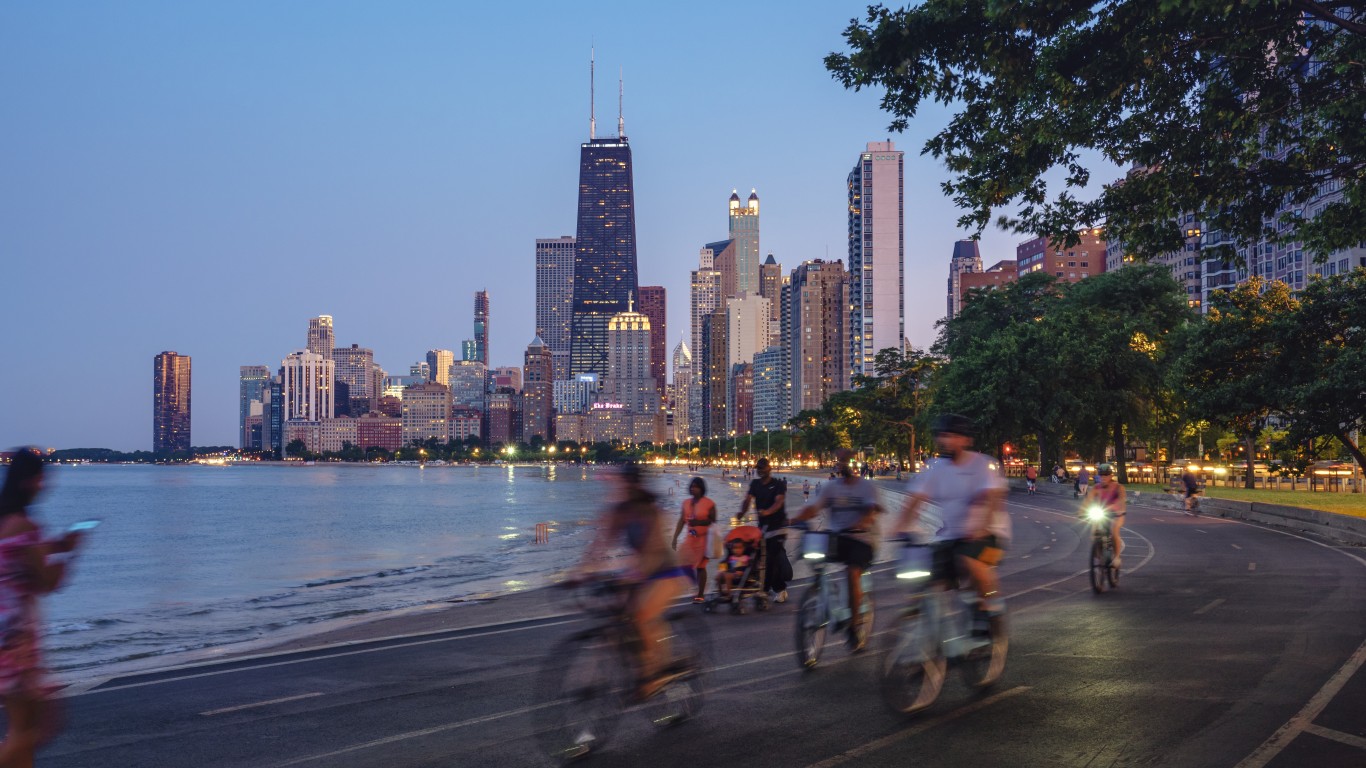
9. Illinois
> Adults who drink excessively: 22.9% (US rate: 19.8%)
> Fatal car accidents involving alcohol: 28.8% — 25th highest (US rate: 26.6%)
> Median household income: $69,187 — 17th highest (US median: $65,712)
> Population: 12,671,821

8. Vermont
> Adults who drink excessively: 23.2% (US rate: 19.8%)
> Fatal car accidents involving alcohol: 35.4% — 7th highest (US rate: 26.6%)
> Median household income: $63,001 — 25th lowest (US median: $65,712)
> Population: 623,989

7. Nebraska
> Adults who drink excessively: 23.2% (US rate: 19.8%)
> Fatal car accidents involving alcohol: 33.2% — 10th highest (US rate: 26.6%)
> Median household income: $63,229 — 25th highest (US median: $65,712)
> Population: 1,934,408

6. Minnesota
> Adults who drink excessively: 23.4% (US rate: 19.8%)
> Fatal car accidents involving alcohol: 29.9% — 22nd highest (US rate: 26.6%)
> Median household income: $74,593 — 13th highest (US median: $65,712)
> Population: 5,639,632
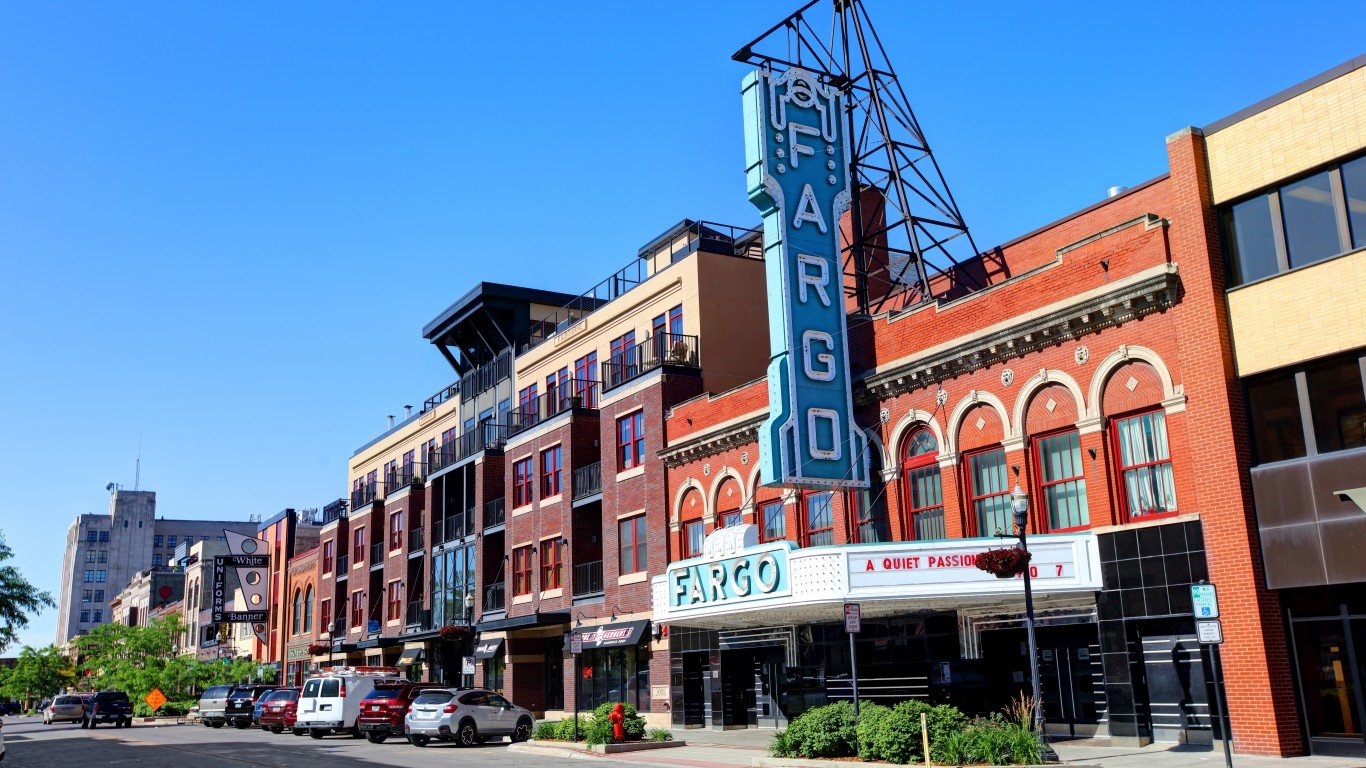
5. North Dakota
> Adults who drink excessively: 24.1% (US rate: 19.8%)
> Fatal car accidents involving alcohol: 41.4% — 2nd highest (US rate: 26.6%)
> Median household income: $64,577 — 20th highest (US median: $65,712)
> Population: 762,062
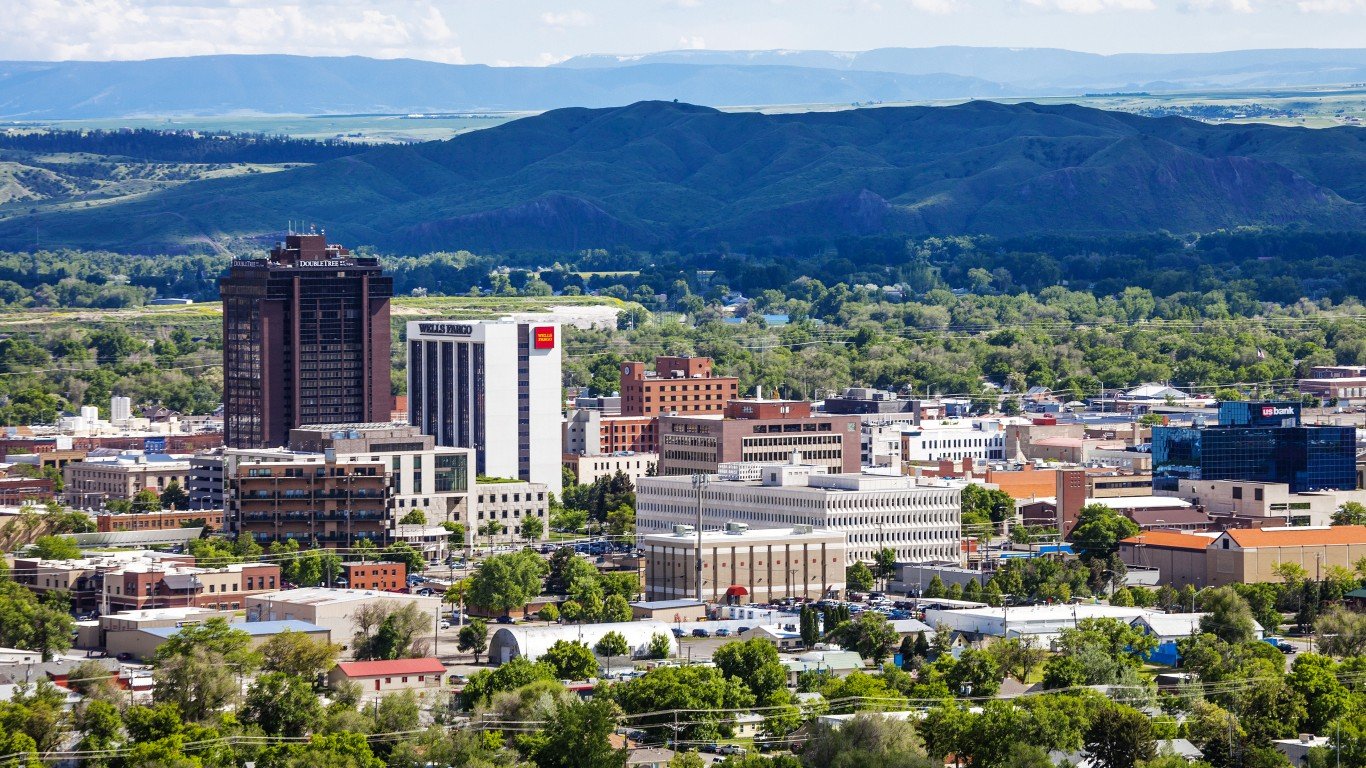
4. Montana
> Adults who drink excessively: 24.3% (US rate: 19.8%)
> Fatal car accidents involving alcohol: 46.4% — the highest (US rate: 26.6%)
> Median household income: $57,153 — 11th lowest (US median: $65,712)
> Population: 1,068,778
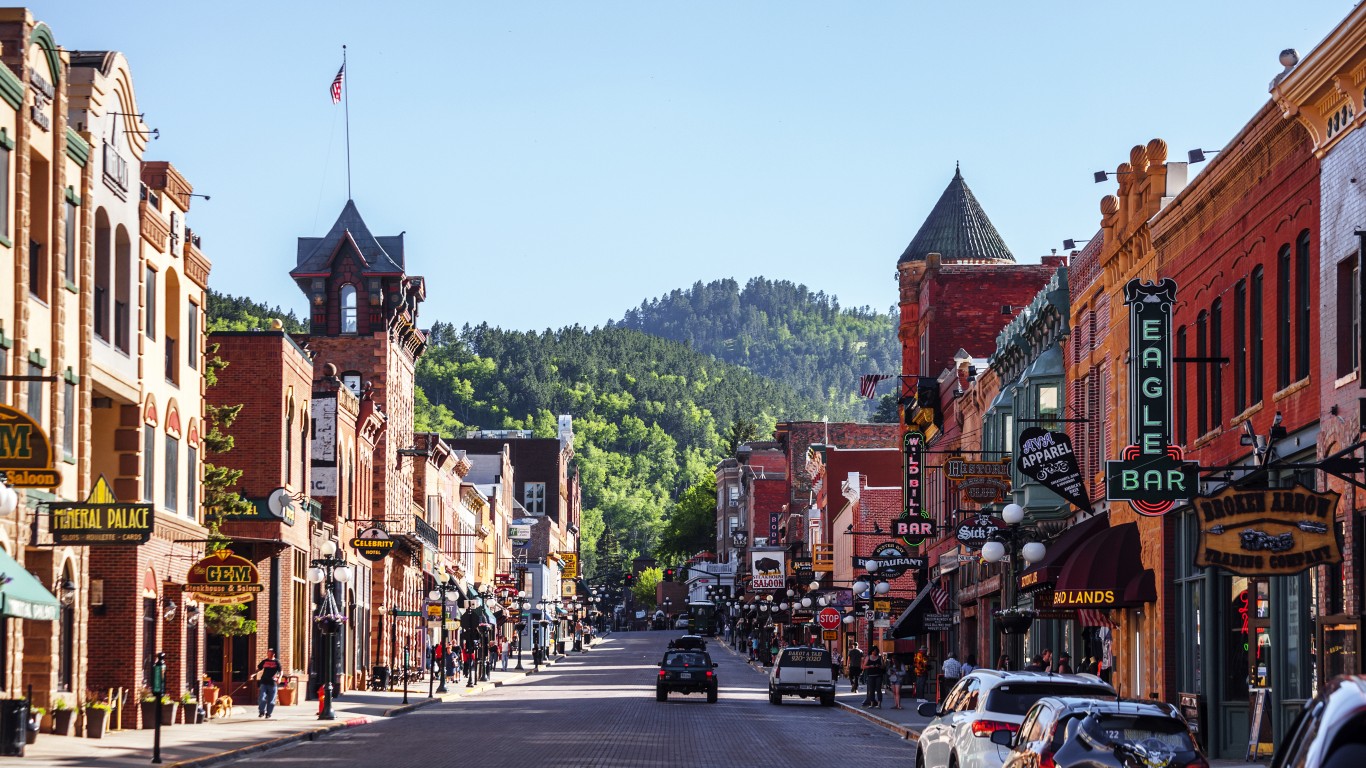
3. South Dakota
> Adults who drink excessively: 24.4% (US rate: 19.8%)
> Fatal car accidents involving alcohol: 36.1% — 5th highest (US rate: 26.6%)
> Median household income: $59,533 — 18th lowest (US median: $65,712)
> Population: 884,659

2. Iowa
> Adults who drink excessively: 24.6% (US rate: 19.8%)
> Fatal car accidents involving alcohol: 26.8% — 19th lowest (US rate: 26.6%)
> Median household income: $61,691 — 21st lowest (US median: $65,712)
> Population: 3,155,070
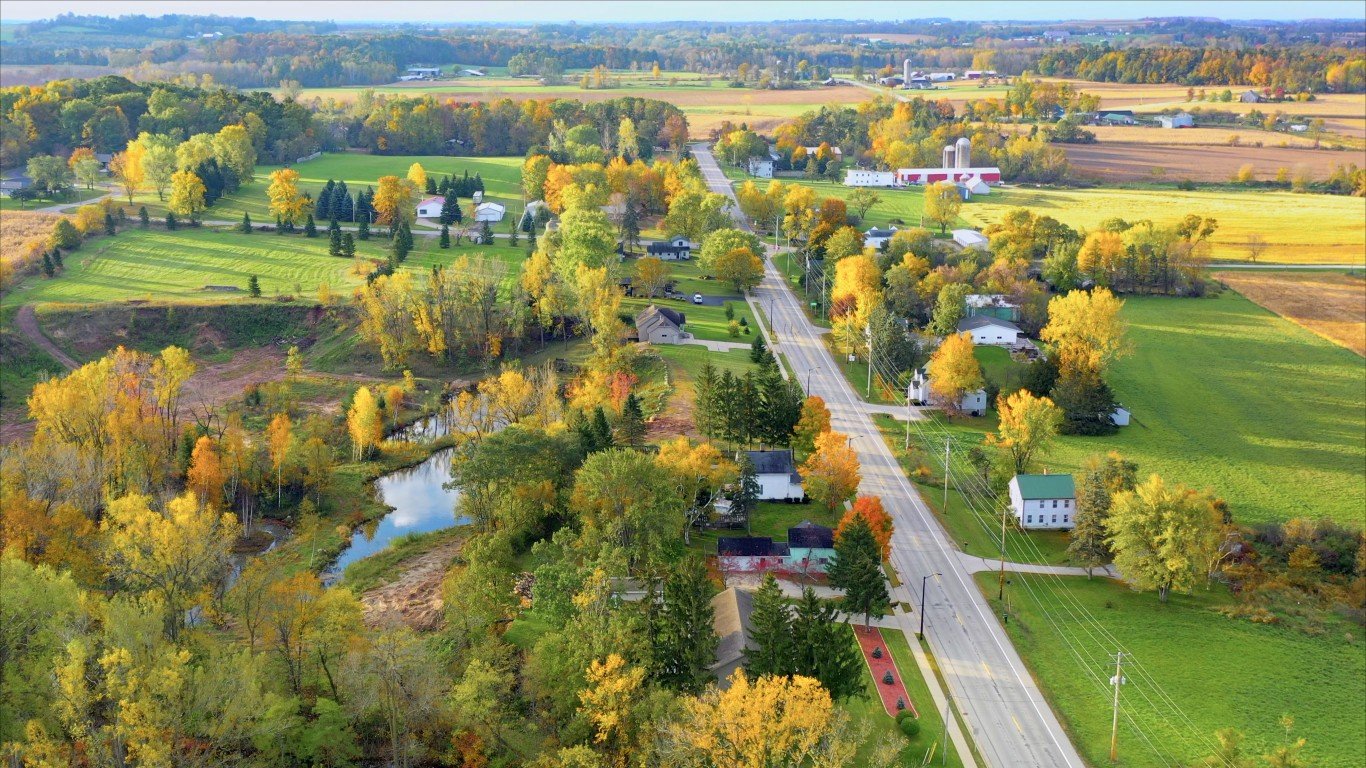
1. Wisconsin
> Adults who drink excessively: 25.2% (US rate: 19.8%)
> Fatal car accidents involving alcohol: 35.6% — 6th highest (US rate: 26.6%)
> Median household income: $64,168 — 21st highest (US median: $65,712)
> Population: 5,822,434
Methodology
To identify the states with the highest excessive drinking rates, 24/7 Tempo reviewed the percentage of adults 18 and older who report binge or heavy drinking within a 30 day period in all 50 states.
Data came from the 2022 county-level data provided by County Health Rankings & Roadmaps, a Robert Wood Johnson Foundation and University of Wisconsin Population Health Institute joint program. All excessive drinking data is as of 2019, the latest year for which data is available.
Median household income and population data came from the U.S. Census Bureau’s 2020 American Community Survey.
Health outcomes, including the share of driving deaths that involve alcohol, were also aggregated from county-level data obtained from County Health Rankings & Roadmaps and are for the most recent years available.
