
Becoming a pharmacist takes a significant amount of invested time and money. It takes between six and eight years of studies , and typically requires more than $40,000 a year to obtain a doctorate in pharmacy and become licensed. Almost 85% of students graduating in 2018 borrowed to pay for their Doctor of Pharmacy (Pharm.D.) title and left school owing on average more than $160,000.
Compensation is a factor in deciding where to work. Even though pharmacists are well paid — the median salary for pharmacists is $126,000 a year — they still need to pay their student debt, which is no easy task. Annual salary, which varies by state, is not the only factor that makes some states better prospective homes than others. Cost of living, which is also uneven across states, and employment projections are also good indicators of where the best pharmacist jobs are located.
24/7 Tempo created an index of these indicators and other data to rank the best and worst states to be a pharmacist.
In 2018, there were about 315,000 people across the United States employed as pharmacists. Demand for such professionals in hospitals and clinics is expected to increase because of an aging population, according to the Bureau of Labor Statistics.
It’s a common misconception that pharmacists just put pills in a bottle, Kelly Moore, a hospital-based pharmacist in New York, told 24/7 Tempo. “But we do a lot more,” Moore added. “We are more of a resource, and people should ask us questions and use our expertise.” Here are 20 other things pharmacists want you to know.
50. Maryland
> Number of pharmacists: 95.2 per 100,000 people (19th lowest)
> Total number of pharmacists as of May 2018: 5,750 (18th most)
> Annual median wage for pharmacists: $122,450 (17th lowest)
> Total burglaries and armed robberies of pharmacies reported in 2018: 70 (4th most)
> Cost of living: 9.4% more than the national average (5th highest)
[entry-topics ids=”28049″]
49. California
> Number of pharmacists: 78.2 per 100,000 people (6th lowest)
> Total number of pharmacists as of May 2018: 30,950 (the most)
> Annual median wage for pharmacists: $144,660 (2nd highest)
> Total burglaries and armed robberies of pharmacies reported in 2018: 319 (the most)
> Cost of living: 14.8% more than the national average (3rd highest)
[entry-topics ids=”1337″]
48. Michigan
> Number of pharmacists: 91.4 per 100,000 people (16th lowest)
> Total number of pharmacists as of May 2018: 9,140 (11th most)
> Annual median wage for pharmacists: $122,320 (15th lowest)
> Total burglaries and armed robberies of pharmacies reported in 2018: 118 (3rd most)
> Cost of living: -7.0% less than the national average (22nd lowest)
[entry-topics ids=”11110″]

47. Texas
> Number of pharmacists: 74.0 per 100,000 people (3rd lowest)
> Total number of pharmacists as of May 2018: 21,250 (2nd most)
> Annual median wage for pharmacists: $128,260 (13th highest)
> Total burglaries and armed robberies of pharmacies reported in 2018: 198 (2nd most)
> Cost of living: -3.0% less than the national average (23rd highest)
[entry-topics ids=”1575″]

46. New Jersey
> Number of pharmacists: 104.2 per 100,000 people (17th highest)
> Total number of pharmacists as of May 2018: 9,280 (10th most)
> Annual median wage for pharmacists: $119,330 (5th lowest)
> Total burglaries and armed robberies of pharmacies reported in 2018: 19 (tied–17th most)
> Cost of living: 12.9% more than the national average (4th highest)
[entry-topics ids=”22720″]

45. Colorado
> Number of pharmacists: 90.9 per 100,000 people (15th lowest)
> Total number of pharmacists as of May 2018: 5,180 (22nd most)
> Annual median wage for pharmacists: $127,490 (17th highest)
> Total burglaries and armed robberies of pharmacies reported in 2018: 31 (12th most)
> Cost of living: 3.2% more than the national average (11th highest)
[entry-topics ids=”180″]
44. Washington
> Number of pharmacists: 76.2 per 100,000 people (4th lowest)
> Total number of pharmacists as of May 2018: 5,740 (19th most)
> Annual median wage for pharmacists: $130,250 (8th highest)
> Total burglaries and armed robberies of pharmacies reported in 2018: 19 (tied–17th most)
> Cost of living: 6.4% more than the national average (8th highest)
[entry-topics ids=”8439″]
43. Delaware
> Number of pharmacists: 109.6 per 100,000 people (12th highest)
> Total number of pharmacists as of May 2018: 1,060 (5th fewest)
> Annual median wage for pharmacists: $125,530 (21st highest)
> Total burglaries and armed robberies of pharmacies reported in 2018: 9 (tied–21st fewest)
> Cost of living: 0.1% more than the national average (14th highest)
[entry-topics ids=”3426″]

42. New York
> Number of pharmacists: 104.4 per 100,000 people (16th highest)
> Total number of pharmacists as of May 2018: 20,400 (4th most)
> Annual median wage for pharmacists: $124,220 (25th highest)
> Total burglaries and armed robberies of pharmacies reported in 2018: 38 (9th most)
> Cost of living: 15.8% more than the national average (2nd highest)
[entry-topics ids=”4614″]
41. Connecticut
> Number of pharmacists: 86.8 per 100,000 people (13th lowest)
> Total number of pharmacists as of May 2018: 3,100 (20th fewest)
> Annual median wage for pharmacists: $125,510 (22nd highest)
> Total burglaries and armed robberies of pharmacies reported in 2018: 2 (tied–13th fewest)
> Cost of living: 8.0% more than the national average (6th highest)
[entry-topics ids=”22247″]
40. Oklahoma
> Number of pharmacists: 88.0 per 100,000 people (14th lowest)
> Total number of pharmacists as of May 2018: 3,470 (23rd fewest)
> Annual median wage for pharmacists: $119,120 (4th lowest)
> Total burglaries and armed robberies of pharmacies reported in 2018: 25 (15th most)
> Cost of living: -11.0% less than the national average (8th lowest)
[entry-topics ids=”6084″]
39. Nevada
> Number of pharmacists: 82.1 per 100,000 people (10th lowest)
> Total number of pharmacists as of May 2018: 2,490 (16th fewest)
> Annual median wage for pharmacists: $128,290 (12th highest)
> Total burglaries and armed robberies of pharmacies reported in 2018: 12 (tied–23rd fewest)
> Cost of living: -2.4% less than the national average (21st highest)
[entry-topics ids=”59354″]

38. Virginia
> Number of pharmacists: 81.8 per 100,000 people (9th lowest)
> Total number of pharmacists as of May 2018: 6,970 (15th most)
> Annual median wage for pharmacists: $128,260 (13th highest)
> Total burglaries and armed robberies of pharmacies reported in 2018: 16 (tied–23rd most)
> Cost of living: 2.1% more than the national average (13th highest)
[entry-topics ids=”1834″]
37. New Hampshire
> Number of pharmacists: 84.0 per 100,000 people (12th lowest)
> Total number of pharmacists as of May 2018: 1,140 (6th fewest)
> Annual median wage for pharmacists: $129,410 (9th highest)
> Total burglaries and armed robberies of pharmacies reported in 2018: 2 (tied–13th fewest)
> Cost of living: 5.8% more than the national average (9th highest)
[entry-topics ids=”22615″]
36. Mississippi
> Number of pharmacists: 76.3 per 100,000 people (5th lowest)
> Total number of pharmacists as of May 2018: 2,280 (15th fewest)
> Annual median wage for pharmacists: $124,770 (24th highest)
> Total burglaries and armed robberies of pharmacies reported in 2018: 17 (tied–21st most)
> Cost of living: -14.3% less than the national average (the lowest)
[entry-topics ids=”59351″]

35. Massachusetts
> Number of pharmacists: 115.5 per 100,000 people (9th highest)
> Total number of pharmacists as of May 2018: 7,970 (12th most)
> Annual median wage for pharmacists: $120,250 (8th lowest)
> Total burglaries and armed robberies of pharmacies reported in 2018: 4 (15th fewest)
> Cost of living: 7.9% more than the national average (7th highest)
[entry-topics ids=”22627″]
34. Tennessee
> Number of pharmacists: 108.3 per 100,000 people (14th highest)
> Total number of pharmacists as of May 2018: 7,330 (14th most)
> Annual median wage for pharmacists: $125,400 (23rd highest)
> Total burglaries and armed robberies of pharmacies reported in 2018: 61 (6th most)
> Cost of living: -9.6% less than the national average (17th lowest)
[entry-topics ids=”59360″]
33. Hawaii
> Number of pharmacists: 120.4 per 100,000 people (7th highest)
> Total number of pharmacists as of May 2018: 1,710 (13th fewest)
> Annual median wage for pharmacists: $122,880 (21st lowest)
> Total burglaries and armed robberies of pharmacies reported in 2018: 0 (tied–the fewest)
> Cost of living: 18.5% more than the national average (the highest)
[entry-topics ids=”14042″]

32. Utah
> Number of pharmacists: 80.4 per 100,000 people (7th lowest)
> Total number of pharmacists as of May 2018: 2,540 (17th fewest)
> Annual median wage for pharmacists: $122,730 (20th lowest)
> Total burglaries and armed robberies of pharmacies reported in 2018: 2 (tied–13th fewest)
> Cost of living: -3.0% less than the national average (23rd highest)
[entry-topics ids=”59361″]
31. New Mexico
> Number of pharmacists: 70.6 per 100,000 people (2nd lowest)
> Total number of pharmacists as of May 2018: 1,480 (11th fewest)
> Annual median wage for pharmacists: $127,610 (16th highest)
> Total burglaries and armed robberies of pharmacies reported in 2018: 8 (19th fewest)
> Cost of living: -6.7% less than the national average (23rd lowest)
[entry-topics ids=”59355″]

30. Nebraska
> Number of pharmacists: 132.2 per 100,000 people (3rd highest)
> Total number of pharmacists as of May 2018: 2,550 (18th fewest)
> Annual median wage for pharmacists: $121,390 (10th lowest)
> Total burglaries and armed robberies of pharmacies reported in 2018: 19 (tied–17th most)
> Cost of living: -10.4% less than the national average (10th lowest)
[entry-topics ids=”11091″]

29. Alaska
> Number of pharmacists: 57.0 per 100,000 people (the lowest)
> Total number of pharmacists as of May 2018: 420 (the fewest)
> Annual median wage for pharmacists: $144,670 (the highest)
> Total burglaries and armed robberies of pharmacies reported in 2018: 0 (tied–the fewest)
> Cost of living: 4.4% more than the national average (10th highest)
[entry-topics ids=”176″]

28. Iowa
> Number of pharmacists: 99.8 per 100,000 people (25th lowest)
> Total number of pharmacists as of May 2018: 3,150 (21st fewest)
> Annual median wage for pharmacists: $119,450 (7th lowest)
> Total burglaries and armed robberies of pharmacies reported in 2018: 12 (tied–23rd fewest)
> Cost of living: -10.2% less than the national average (12th lowest)
[entry-topics ids=”59348″]
27. Illinois
> Number of pharmacists: 96.2 per 100,000 people (21st lowest)
> Total number of pharmacists as of May 2018: 12,260 (7th most)
> Annual median wage for pharmacists: $128,460 (11th highest)
> Total burglaries and armed robberies of pharmacies reported in 2018: 36 (10th most)
> Cost of living: -1.5% less than the national average (18th highest)
[entry-topics ids=”11106″]

26. Indiana
> Number of pharmacists: 83.7 per 100,000 people (11th lowest)
> Total number of pharmacists as of May 2018: 5,600 (20th most)
> Annual median wage for pharmacists: $123,770 (24th lowest)
> Total burglaries and armed robberies of pharmacies reported in 2018: 22 (16th most)
> Cost of living: -10.2% less than the national average (12th lowest)
[entry-topics ids=”35717″]

25. Wyoming
> Number of pharmacists: 102.1 per 100,000 people (22nd highest)
> Total number of pharmacists as of May 2018: 590 (2nd fewest)
> Annual median wage for pharmacists: $122,250 (14th lowest)
> Total burglaries and armed robberies of pharmacies reported in 2018: 2 (tied–13th fewest)
> Cost of living: -4.8% less than the national average (25th lowest)
[entry-topics ids=”19422″]

24. Pennsylvania
> Number of pharmacists: 114.1 per 100,000 people (10th highest)
> Total number of pharmacists as of May 2018: 14,610 (5th most)
> Annual median wage for pharmacists: $120,530 (9th lowest)
> Total burglaries and armed robberies of pharmacies reported in 2018: 54 (7th most)
> Cost of living: -2.1% less than the national average (20th highest)
[entry-topics ids=”11113″]
23. Kansas
> Number of pharmacists: 102.7 per 100,000 people (20th highest)
> Total number of pharmacists as of May 2018: 2,990 (19th fewest)
> Annual median wage for pharmacists: $124,120 (25th lowest)
> Total burglaries and armed robberies of pharmacies reported in 2018: 13 (24th fewest)
> Cost of living: -10.0% less than the national average (13th lowest)
[entry-topics ids=”14041″]
22. Florida
> Number of pharmacists: 97.6 per 100,000 people (23rd lowest)
> Total number of pharmacists as of May 2018: 20,790 (3rd most)
> Annual median wage for pharmacists: $122,540 (19th lowest)
> Total burglaries and armed robberies of pharmacies reported in 2018: 29 (13th most)
> Cost of living: -0.1% less than the national average (15th highest)
[entry-topics ids=”1657″]

21. Ohio
> Number of pharmacists: 106.9 per 100,000 people (15th highest)
> Total number of pharmacists as of May 2018: 12,500 (6th most)
> Annual median wage for pharmacists: $121,770 (11th lowest)
> Total burglaries and armed robberies of pharmacies reported in 2018: 63 (5th most)
> Cost of living: -11.1% less than the national average (7th lowest)
[entry-topics ids=”4458″]

20. Georgia
> Number of pharmacists: 100.1 per 100,000 people (24th highest)
> Total number of pharmacists as of May 2018: 10,530 (8th most)
> Annual median wage for pharmacists: $122,460 (18th lowest)
> Total burglaries and armed robberies of pharmacies reported in 2018: 32 (11th most)
> Cost of living: -7.5% less than the national average (20th lowest)
[entry-topics ids=”22721″]

19. Alabama
> Number of pharmacists: 99.8 per 100,000 people (25th highest)
> Total number of pharmacists as of May 2018: 4,880 (25th most)
> Annual median wage for pharmacists: $122,390 (16th lowest)
> Total burglaries and armed robberies of pharmacies reported in 2018: 28 (14th most)
> Cost of living: -13.3% less than the national average (3rd lowest)
[entry-topics ids=”8017″]

18. North Carolina
> Number of pharmacists: 96.0 per 100,000 people (20th lowest)
> Total number of pharmacists as of May 2018: 9,970 (9th most)
> Annual median wage for pharmacists: $127,250 (18th highest)
> Total burglaries and armed robberies of pharmacies reported in 2018: 44 (8th most)
> Cost of living: -8.7% less than the national average (18th lowest)
[entry-topics ids=”20037″]
17. Idaho
> Number of pharmacists: 80.4 per 100,000 people (8th lowest)
> Total number of pharmacists as of May 2018: 1,410 (10th fewest)
> Annual median wage for pharmacists: $123,120 (23rd lowest)
> Total burglaries and armed robberies of pharmacies reported in 2018: 1 (tied–9th fewest)
> Cost of living: -7.0% less than the national average (22nd lowest)
[entry-topics ids=”59347″]
16. South Carolina
> Number of pharmacists: 99.7 per 100,000 people (24th lowest)
> Total number of pharmacists as of May 2018: 5,070 (23rd most)
> Annual median wage for pharmacists: $126,670 (19th highest)
> Total burglaries and armed robberies of pharmacies reported in 2018: 19 (tied–17th most)
> Cost of living: -9.6% less than the national average (17th lowest)
[entry-topics ids=”11112″]

15. Louisiana
> Number of pharmacists: 97.0 per 100,000 people (22nd lowest)
> Total number of pharmacists as of May 2018: 4,520 (25th fewest)
> Annual median wage for pharmacists: $119,370 (6th lowest)
> Total burglaries and armed robberies of pharmacies reported in 2018: 6 (16th fewest)
> Cost of living: -9.9% less than the national average (15th lowest)
[entry-topics ids=”59350″]
14. Arkansas
> Number of pharmacists: 108.5 per 100,000 people (13th highest)
> Total number of pharmacists as of May 2018: 3,270 (22nd fewest)
> Annual median wage for pharmacists: $122,110 (12th lowest)
> Total burglaries and armed robberies of pharmacies reported in 2018: 16 (tied–23rd most)
> Cost of living: -13.5% less than the national average (2nd lowest)
[entry-topics ids=”50255″]

13. Wisconsin
> Number of pharmacists: 92.7 per 100,000 people (17th lowest)
> Total number of pharmacists as of May 2018: 5,390 (21st most)
> Annual median wage for pharmacists: $131,450 (7th highest)
> Total burglaries and armed robberies of pharmacies reported in 2018: 9 (tied–21st fewest)
> Cost of living: -7.6% less than the national average (19th lowest)
[entry-topics ids=”11108″]
12. Maine
> Number of pharmacists: 93.4 per 100,000 people (18th lowest)
> Total number of pharmacists as of May 2018: 1,250 (8th fewest)
> Annual median wage for pharmacists: $135,510 (6th highest)
> Total burglaries and armed robberies of pharmacies reported in 2018: 3 (14th fewest)
> Cost of living: -1.6% less than the national average (19th highest)
[entry-topics ids=”36448″]

11. Missouri
> Number of pharmacists: 100.9 per 100,000 people (23rd highest)
> Total number of pharmacists as of May 2018: 6,180 (17th most)
> Annual median wage for pharmacists: $129,000 (10th highest)
> Total burglaries and armed robberies of pharmacies reported in 2018: 16 (tied–23rd most)
> Cost of living: -10.5% less than the national average (9th lowest)
[entry-topics ids=”28577″]
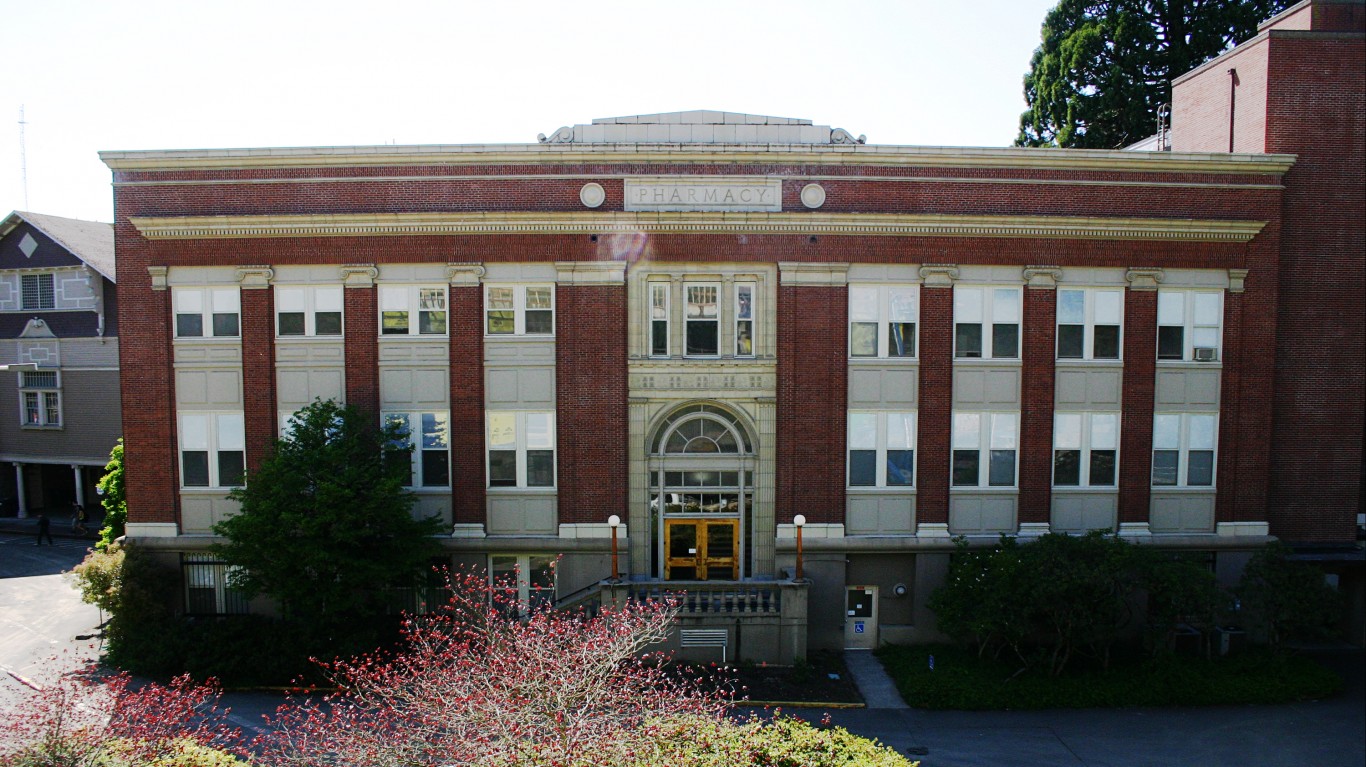
10. Oregon
> Number of pharmacists: 104.0 per 100,000 people (18th highest)
> Total number of pharmacists as of May 2018: 4,360 (24th fewest)
> Annual median wage for pharmacists: $137,620 (4th highest)
> Total burglaries and armed robberies of pharmacies reported in 2018: 7 (tied–18th fewest)
> Cost of living: -0.5% less than the national average (16th highest)
[entry-topics ids=”59358″]
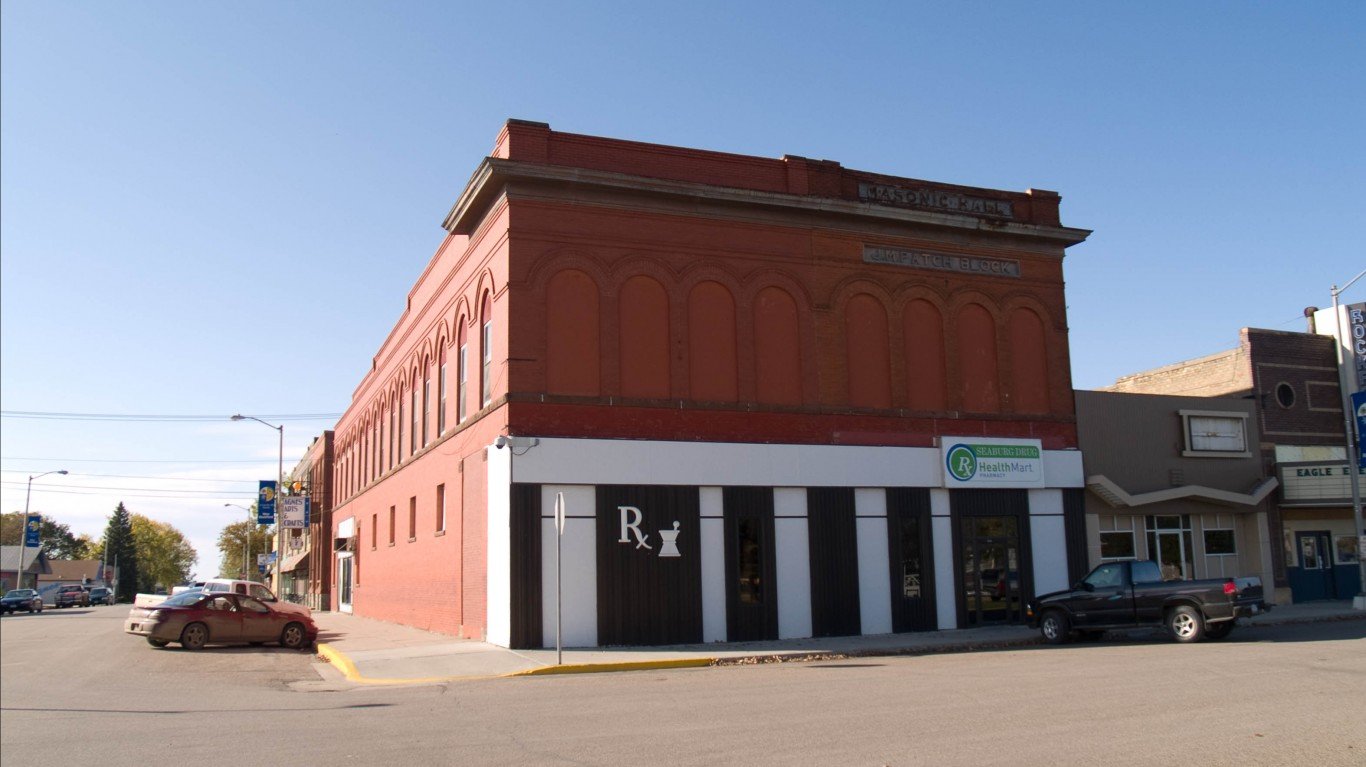
9. North Dakota
> Number of pharmacists: 135.5 per 100,000 people (2nd highest)
> Total number of pharmacists as of May 2018: 1,030 (4th fewest)
> Annual median wage for pharmacists: $115,340 (the lowest)
> Total burglaries and armed robberies of pharmacies reported in 2018: 1 (tied–9th fewest)
> Cost of living: -9.9% less than the national average (15th lowest)
[entry-topics ids=”15103″]

8. Minnesota
> Number of pharmacists: 115.7 per 100,000 people (8th highest)
> Total number of pharmacists as of May 2018: 6,490 (16th most)
> Annual median wage for pharmacists: $136,540 (5th highest)
> Total burglaries and armed robberies of pharmacies reported in 2018: 17 (tied–21st most)
> Cost of living: -2.5% less than the national average (22nd highest)
[entry-topics ids=”19886″]
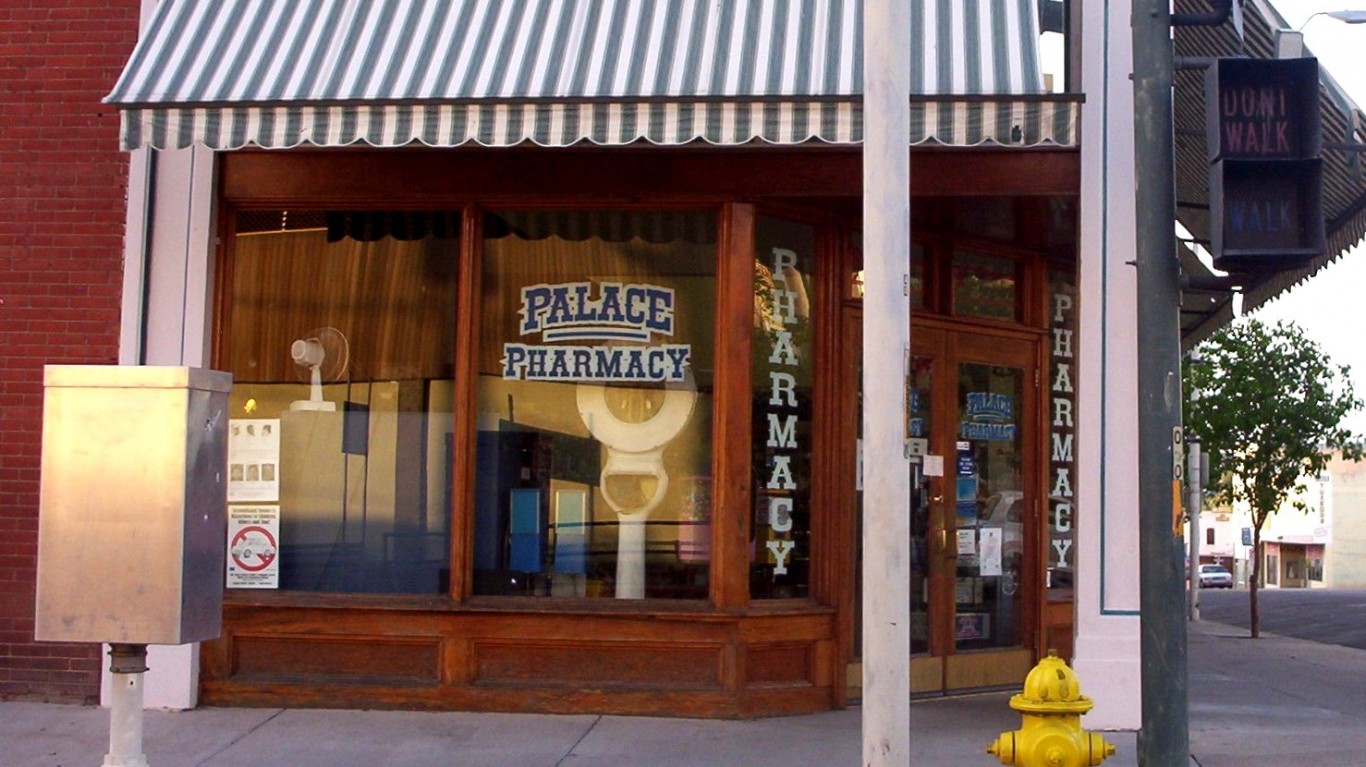
7. Arizona
> Number of pharmacists: 103.5 per 100,000 people (19th highest)
> Total number of pharmacists as of May 2018: 7,420 (13th most)
> Annual median wage for pharmacists: $127,800 (15th highest)
> Total burglaries and armed robberies of pharmacies reported in 2018: 7 (tied–18th fewest)
> Cost of living: -3.6% less than the national average (25th highest)
[entry-topics ids=”24592″]

6. Kentucky
> Number of pharmacists: 112.1 per 100,000 people (11th highest)
> Total number of pharmacists as of May 2018: 5,010 (24th most)
> Annual median wage for pharmacists: $126,310 (20th highest)
> Total burglaries and armed robberies of pharmacies reported in 2018: 15 (25th fewest)
> Cost of living: -12.1% less than the national average (5th lowest)
[entry-topics ids=”59349″]

5. Vermont
> Number of pharmacists: 102.2 per 100,000 people (21st highest)
> Total number of pharmacists as of May 2018: 640 (3rd fewest)
> Annual median wage for pharmacists: $139,970 (3rd highest)
> Total burglaries and armed robberies of pharmacies reported in 2018: 0 (tied–the fewest)
> Cost of living: 2.5% more than the national average (12th highest)
[entry-topics ids=”1866″]
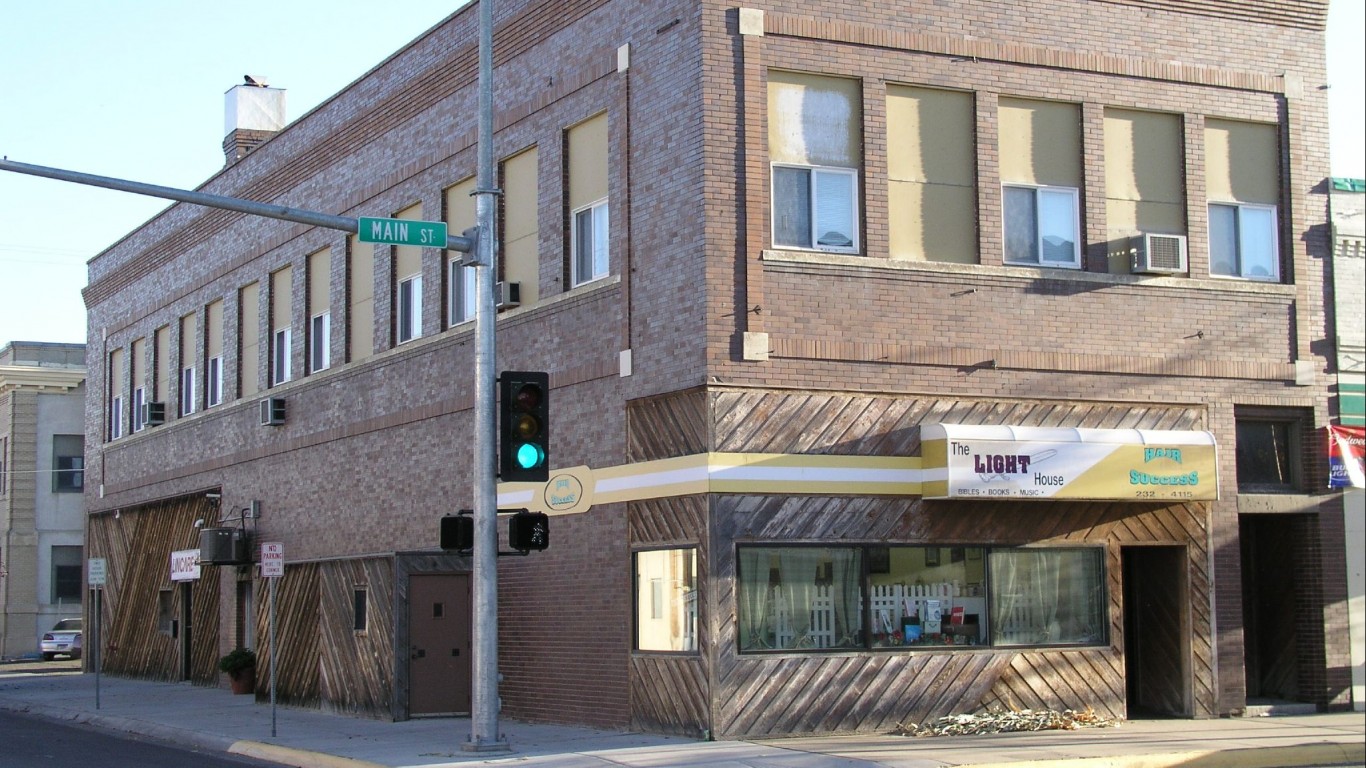
4. Montana
> Number of pharmacists: 128.0 per 100,000 people (5th highest)
> Total number of pharmacists as of May 2018: 1,360 (9th fewest)
> Annual median wage for pharmacists: $117,580 (2nd lowest)
> Total burglaries and armed robberies of pharmacies reported in 2018: 0 (tied–the fewest)
> Cost of living: -5.4% less than the national average (24th lowest)
[entry-topics ids=”3837″]
3. South Dakota
> Number of pharmacists: 130.4 per 100,000 people (4th highest)
> Total number of pharmacists as of May 2018: 1,150 (7th fewest)
> Annual median wage for pharmacists: $118,140 (3rd lowest)
> Total burglaries and armed robberies of pharmacies reported in 2018: 0 (tied–the fewest)
> Cost of living: -11.8% less than the national average (6th lowest)
[entry-topics ids=”14040″]
2. Rhode Island
> Number of pharmacists: 157.9 per 100,000 people (the highest)
> Total number of pharmacists as of May 2018: 1,670 (12th fewest)
> Annual median wage for pharmacists: $122,170 (13th lowest)
> Total burglaries and armed robberies of pharmacies reported in 2018: 0 (tied–the fewest)
> Cost of living: -1.4% less than the national average (17th highest)
[entry-topics ids=”9799″]

1. West Virginia
> Number of pharmacists: 120.7 per 100,000 people (6th highest)
> Total number of pharmacists as of May 2018: 2,180 (14th fewest)
> Annual median wage for pharmacists: $122,980 (22nd lowest)
> Total burglaries and armed robberies of pharmacies reported in 2018: 0 (tied–the fewest)
> Cost of living: -13.0% less than the national average (4th lowest)
[entry-topics ids=”38858″]
To identify the best and worst states to be a pharmacist, 24/7 Tempo created an index of seven measures that fall into two categories: overall quality of life and quality of pharmacist job.
In the quality of job category, we measured burglary and armed robbery rates of retail and chain pharmacies in each state, concentration of pharmacists in every state, annual median wage, and employment rate for pharmacists. Each measure was given full weight.
In the overall quality of life category we measured cost of living, as determined by the average cost of goods and services in an area relative to the nation as a whole, and housing costs, including average monthly housing costs for homeowners with a mortgage and median gross rent. Each measure was given half weight.
Wage, employment, and location quotient, which is a measure used to reflect the demand for pharmacists in a certain area, came from the May 2018 Occupation Employment Statistics (OES) program from the Bureau of Labor Statistics (BLS). Burglary and armed robbery rate per 100,000 total population was derived from the DEA’s Theft and Loss Report for 2018. Civilian population without health insurance, monthly housing costs, median gross rent, and the 2018 total population used to adjust employment and crime rates was derived from the American Community Survey 2018 1-Year Estimates. Regional price parity for 2017 is from the Bureau of Economic Analysis.