
Each year, alcohol misuse is directly linked to diseases and accidents that kill an estimated 95,000 Americans. Excessive drinking also costs the economy hundreds of billions of dollars annually, mostly in lost productivity.
Excessive drinking — along with tobacco use, inadequate exercise, and poor nutrition — is one of four main risk factors for preventable disease identified by the CDC. In addition to short-term consequences, such as impaired judgement and motor skills, excessive alcohol consumption is associated with liver disease, certain cancers, increased risk of a heart attack or stroke, and poor mental health. Here is a look at 23 ways a drinking habit can harm you.
Still, each day, millions of American adults enjoy alcohol responsibly. Moderate drinking — defined as two standard drinks per day for men and one standard drink for women — carries relatively little risk, and may even have some health benefits.
Using data from County Health Rankings & Roadmaps, a joint program between the Robert Wood Johnson Foundation and the University of Wisconsin Population Health Institute, 24/7 Wall St. identified the U.S. counties with the lowest excessive drinking rates.
Counties are ranked on the share of adults who either binge drink or drink heavily. CHR defines binge drinking as consumption of more than four drinks in a single occasion for women and more than five drinks for men, while heavy drinking is defined as more than one drink a day on average for women and more than two drinks a day for men. In every county on this list, fewer than 12.5% of adults drink excessively, while nationwide, more than 19% do.
The vast majority of counties on this list are located in one of just two states — Mississippi and Utah.
It is important to note that alcohol affects everyone differently, and as a general rule, drinking less is better than drinking more. Additionally, the vast majority of Americans who drink excessively — about 90% of them — do not have a severe alcohol use disorder, a chronic disease commonly referred to as alcoholism.
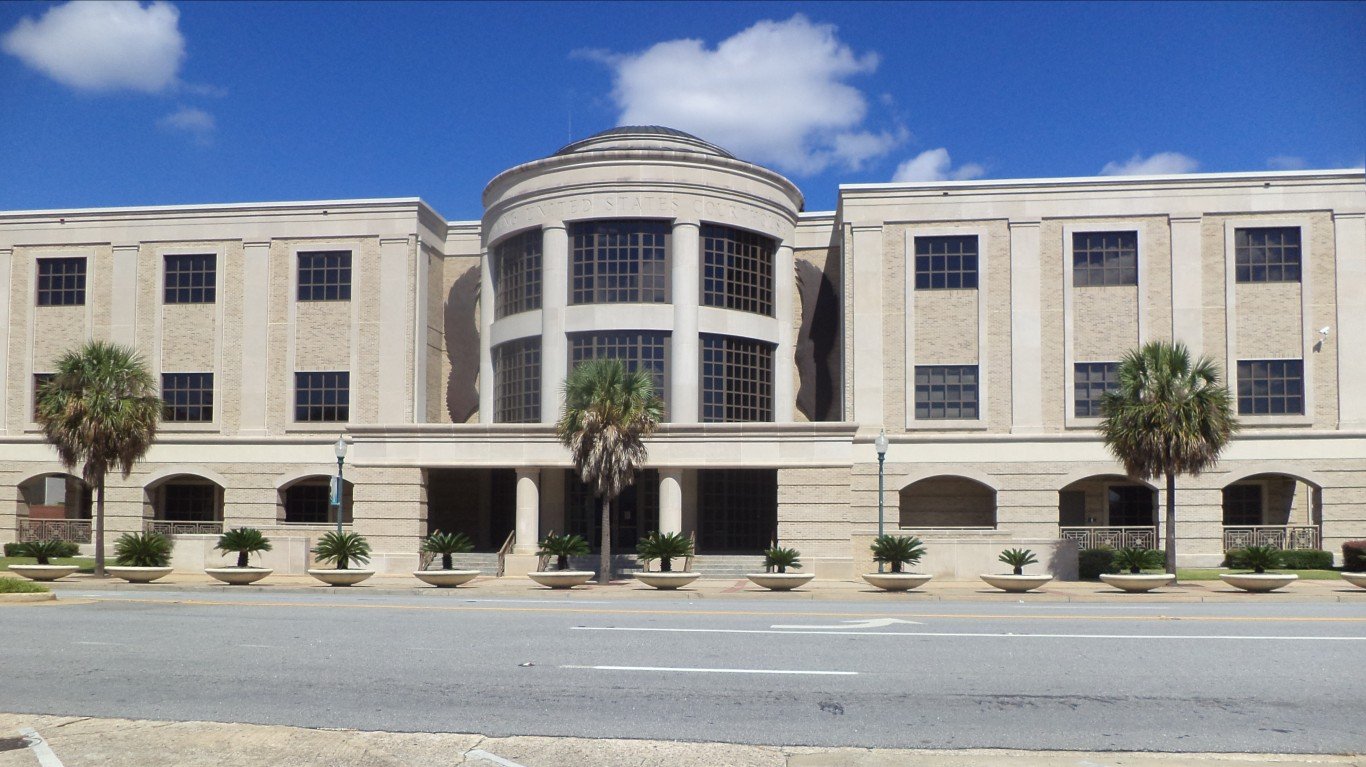
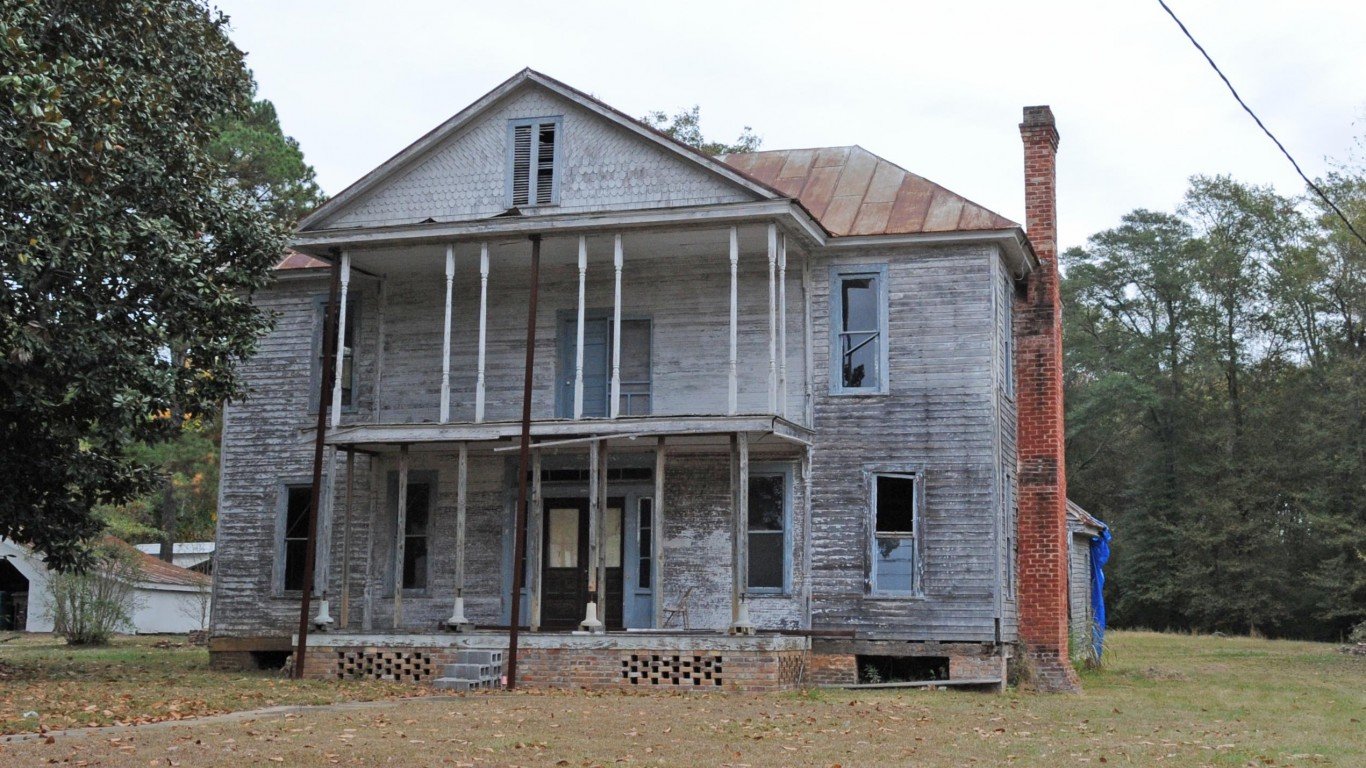
50. Dougherty County, Georgia
> Adults binge or heavy drinking: 12.4%
> Driving deaths involving alcohol: 5.7% — 172nd lowest of 3,081 counties
> Median household income: $39,584 — 396th lowest of 3,106 counties
> Adults reporting poor or fair health: 26.6% — 359th highest of 3,106 counties
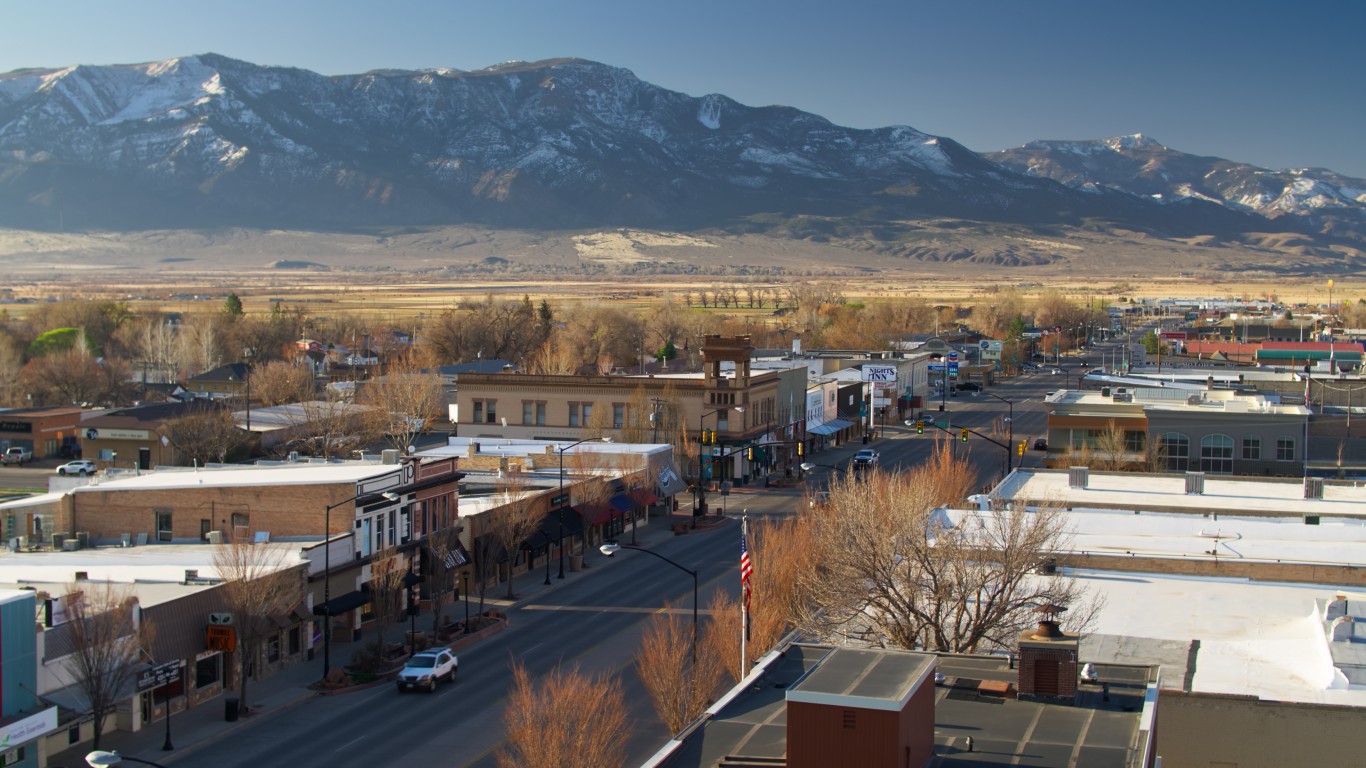
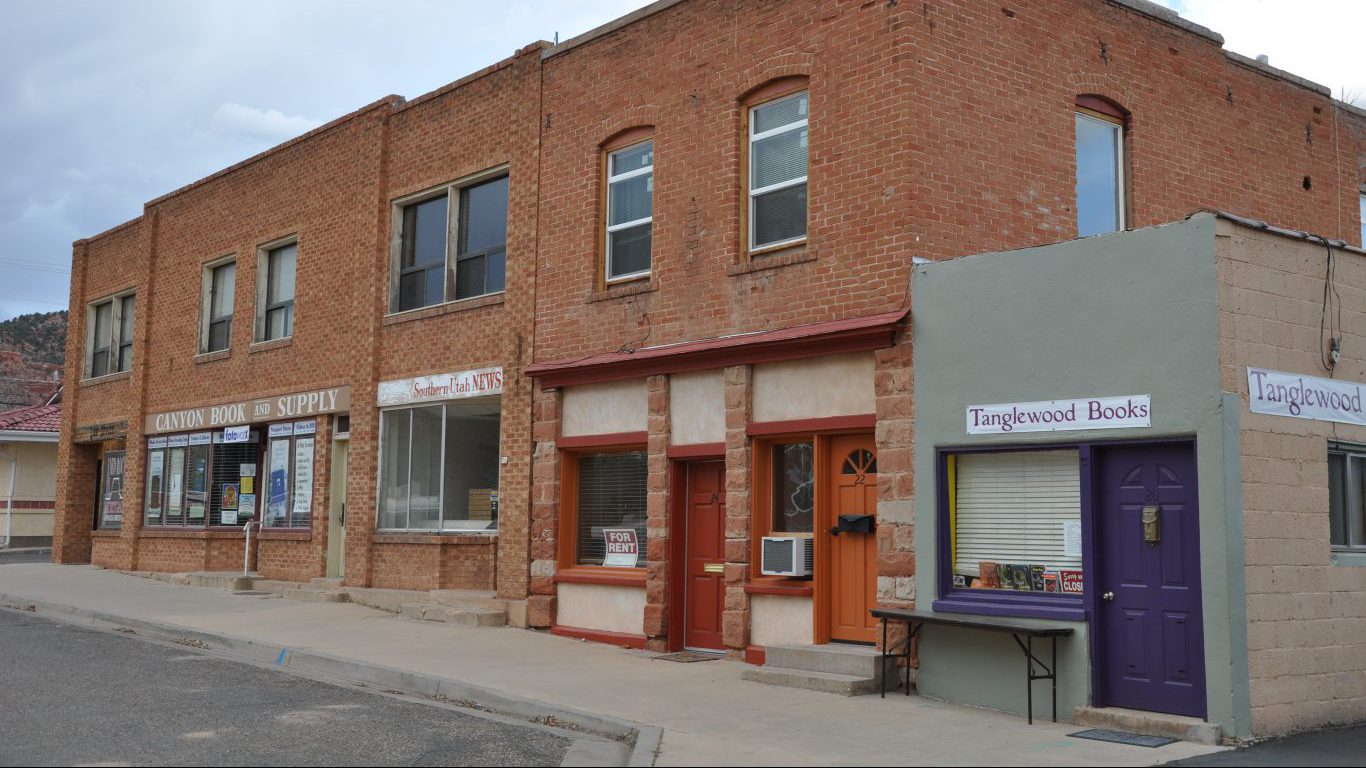
49. Sevier County, Utah
> Adults binge or heavy drinking: 12.4%
> Driving deaths involving alcohol: 9.5% — 249th lowest of 3,081 counties (tied)
> Median household income: $54,799 — 1,192nd highest of 3,106 counties
> Adults reporting poor or fair health: 17.3% — 1,021st lowest of 3,106 counties

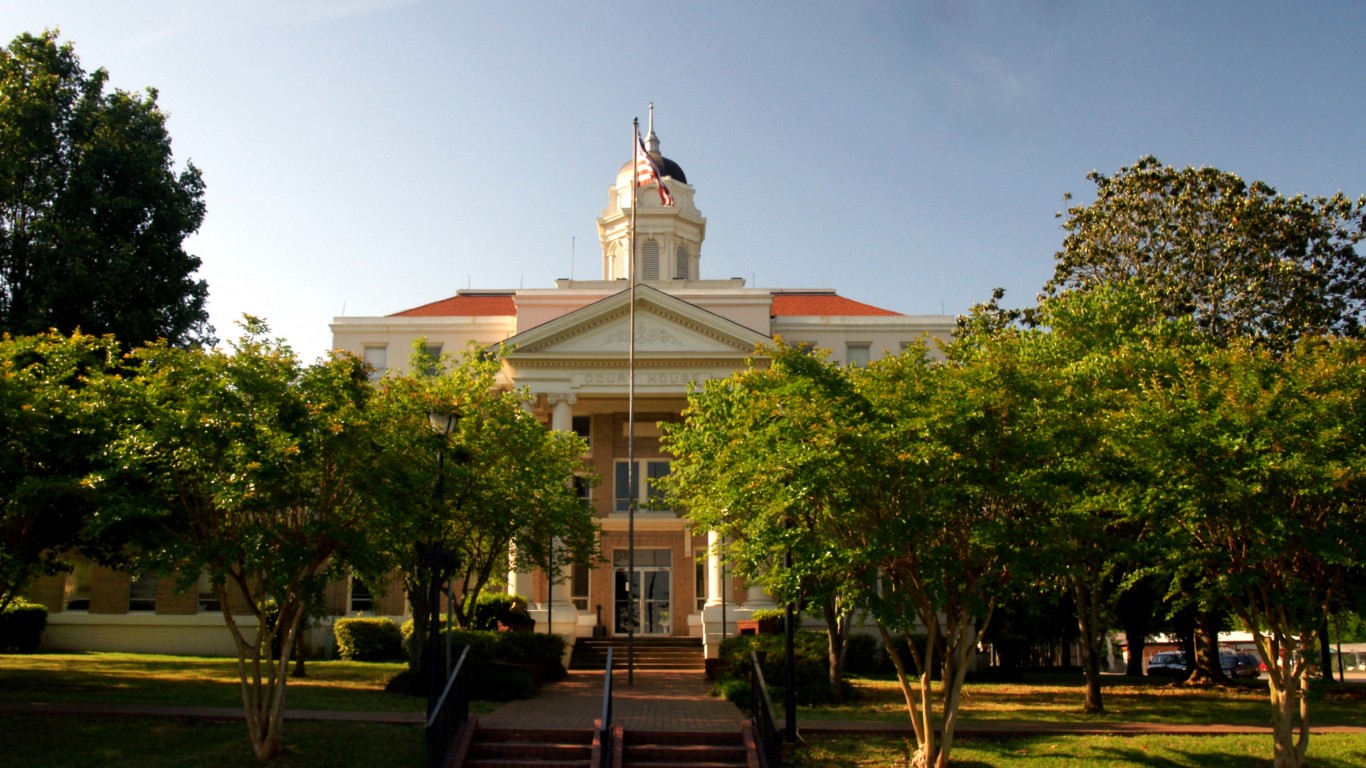
48. Pike County, Mississippi
> Adults binge or heavy drinking: 12.3%
> Driving deaths involving alcohol: 23.8% — 1,227th lowest of 3,081 counties (tied)
> Median household income: $31,784 — 82nd lowest of 3,106 counties
> Adults reporting poor or fair health: 29.6% — 128th highest of 3,106 counties
47. Kemper County, Mississippi
> Adults binge or heavy drinking: 12.3%
> Driving deaths involving alcohol: 31.4% — 1,047th highest of 3,081 counties (tied)
> Median household income: $31,103 — 73rd lowest of 3,106 counties
> Adults reporting poor or fair health: 30.8% — 85th highest of 3,106 counties
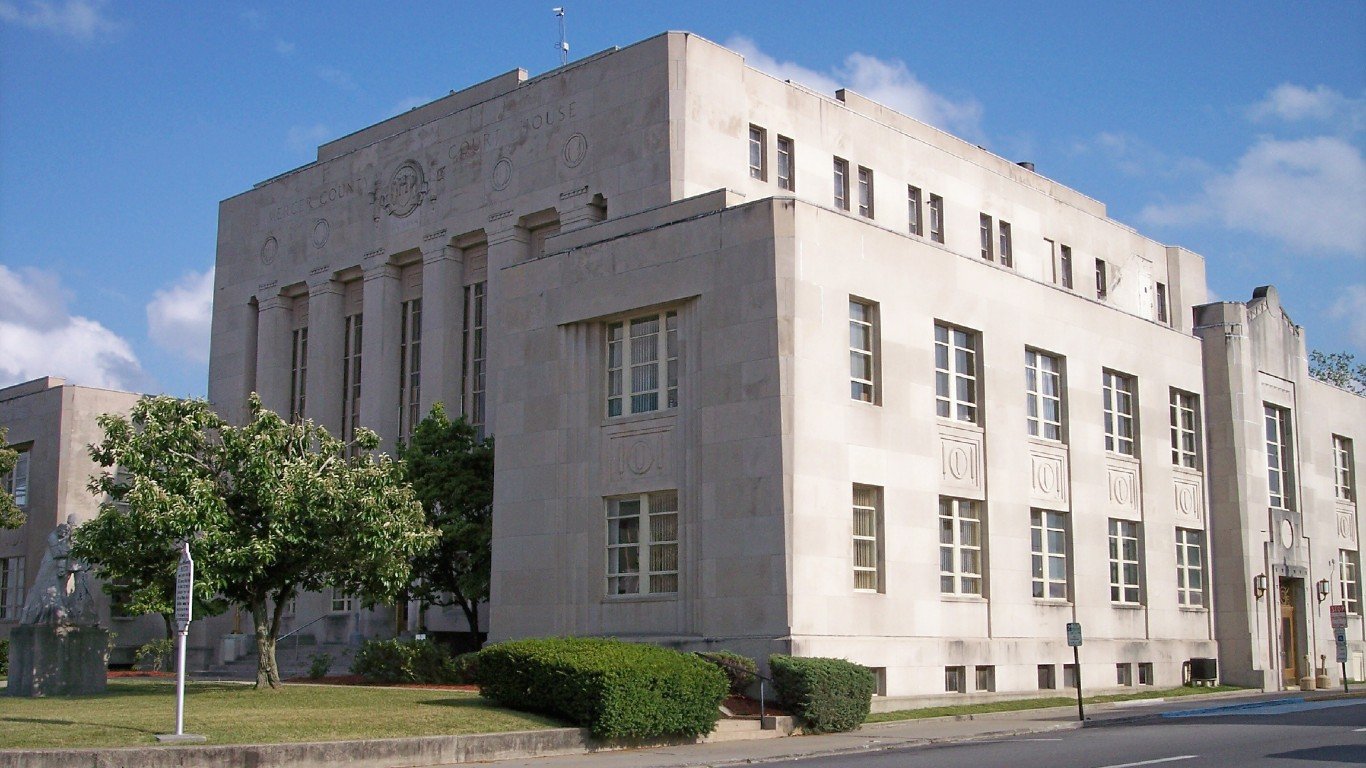
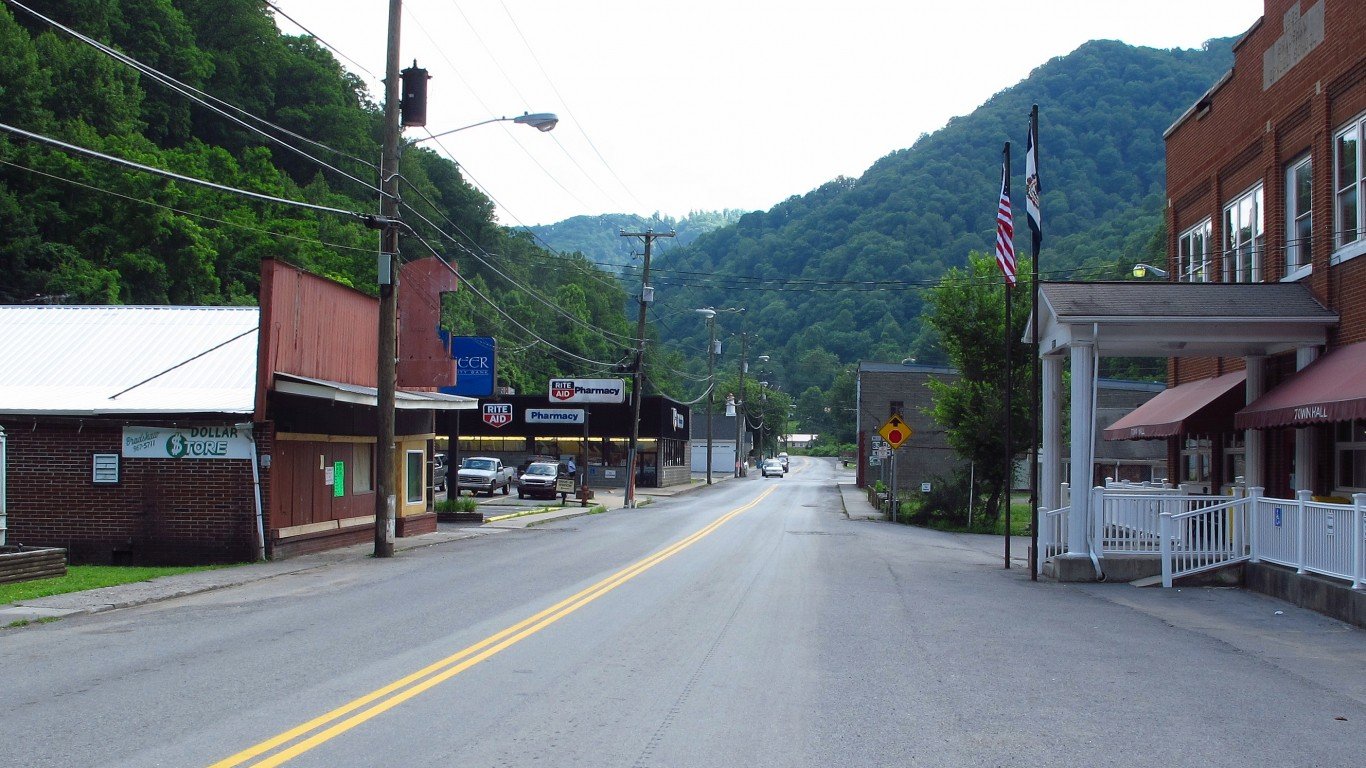
46. Mercer County, West Virginia
> Adults binge or heavy drinking: 12.3%
> Driving deaths involving alcohol: 20.4% — 908th lowest of 3,081 counties
> Median household income: $40,784 — 484th lowest of 3,106 counties
> Adults reporting poor or fair health: 26.7% — 346th highest of 3,106 counties
45. McDowell County, West Virginia
> Adults binge or heavy drinking: 12.3%
> Driving deaths involving alcohol: 35.7% — 678th highest of 3,081 counties (tied)
> Median household income: $27,682 — 30th lowest of 3,106 counties
> Adults reporting poor or fair health: 36.5% — 11th highest of 3,106 counties

44. Jefferson Davis County, Mississippi
> Adults binge or heavy drinking: 12.3%
> Driving deaths involving alcohol: 12.5% — 348th lowest of 3,081 counties (tied)
> Median household income: $32,116 — 92nd lowest of 3,106 counties
> Adults reporting poor or fair health: 29.3% — 141st highest of 3,106 counties
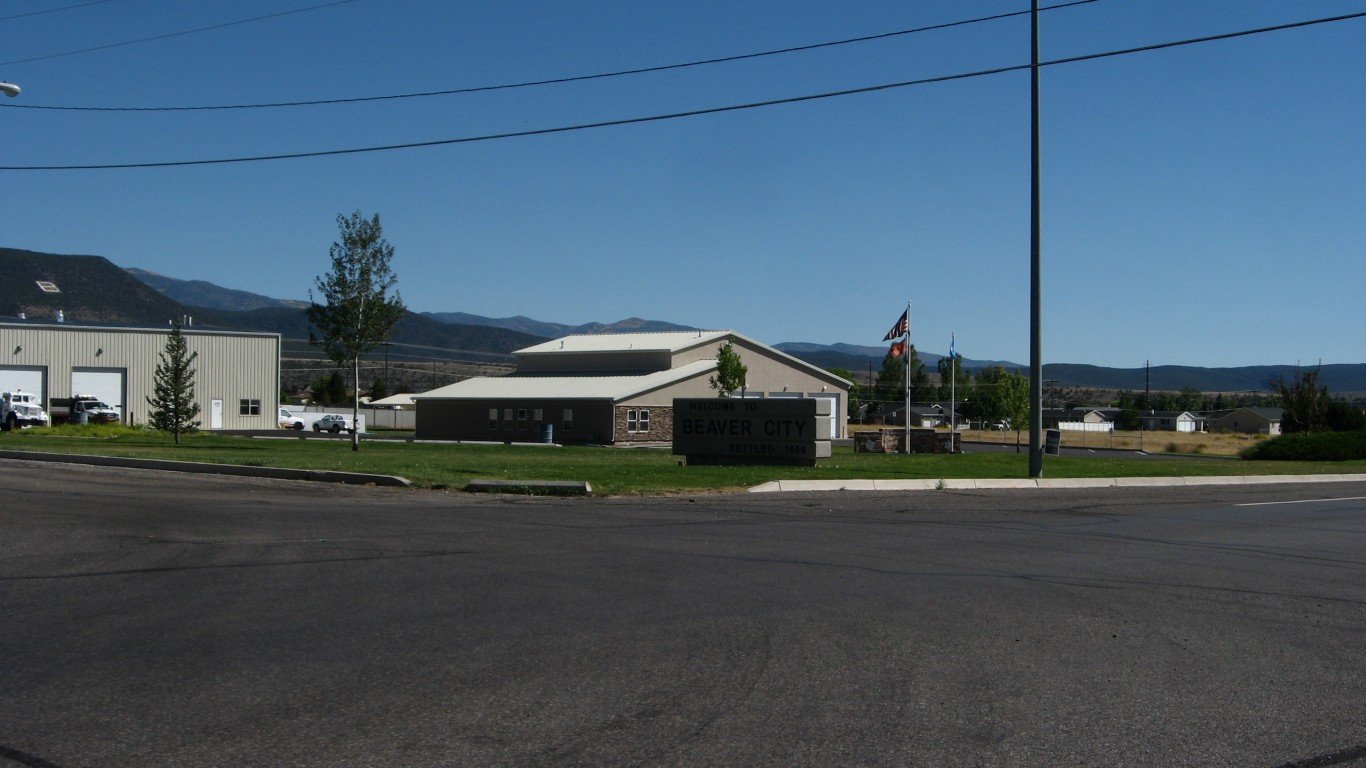
43. Beaver County, Utah
> Adults binge or heavy drinking: 12.2%
> Driving deaths involving alcohol: 0.0% reported — the lowest of 3,081 counties (tied)
> Median household income: $55,221 — 1,148th highest of 3,106 counties
> Adults reporting poor or fair health: 16.7% — 884th lowest of 3,106 counties

42. Weber County, Utah
> Adults binge or heavy drinking: 12.2%
> Driving deaths involving alcohol: 14.7% — 490th lowest of 3,081 counties
> Median household income: $67,244 — 380th highest of 3,106 counties
> Adults reporting poor or fair health: 15.9% — 709th lowest of 3,106 counties
41. Washington County, Mississippi
> Adults binge or heavy drinking: 12.1%
> Driving deaths involving alcohol: 17.5% — 675th lowest of 3,081 counties (tied)
> Median household income: $29,705 — 46th lowest of 3,106 counties
> Adults reporting poor or fair health: 29.4% — 135th highest of 3,106 counties
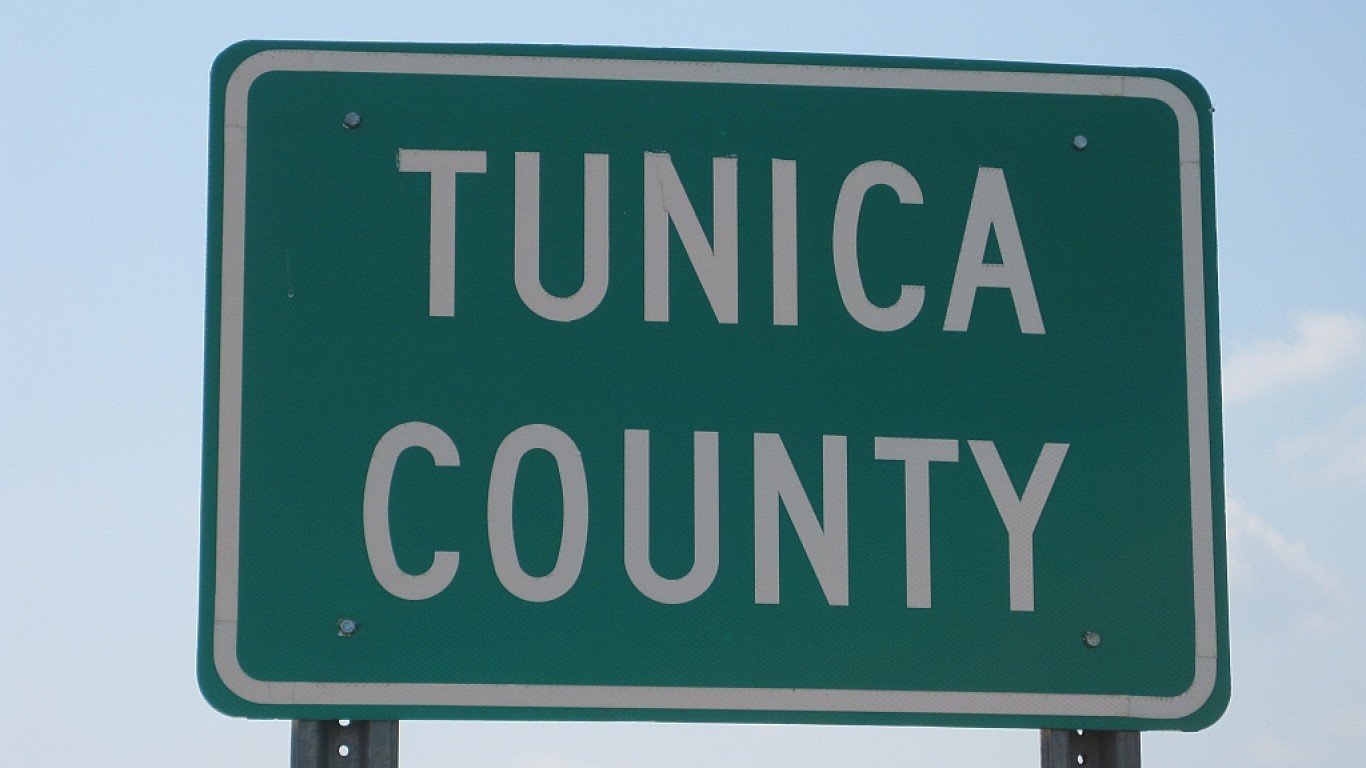
40. Tunica County, Mississippi
> Adults binge or heavy drinking: 12.0%
> Driving deaths involving alcohol: 25.0% — 1,312th lowest of 3,081 counties (tied)
> Median household income: $39,370 — 385th lowest of 3,106 counties
> Adults reporting poor or fair health: 28.1% — 207th highest of 3,106 counties
39. Kane County, Utah
> Adults binge or heavy drinking: 12.0%
> Driving deaths involving alcohol: 27.3% — 1,456th highest of 3,081 counties (tied)
> Median household income: $47,044 — 1,036th lowest of 3,106 counties
> Adults reporting poor or fair health: 15.1% — 542nd lowest of 3,106 counties
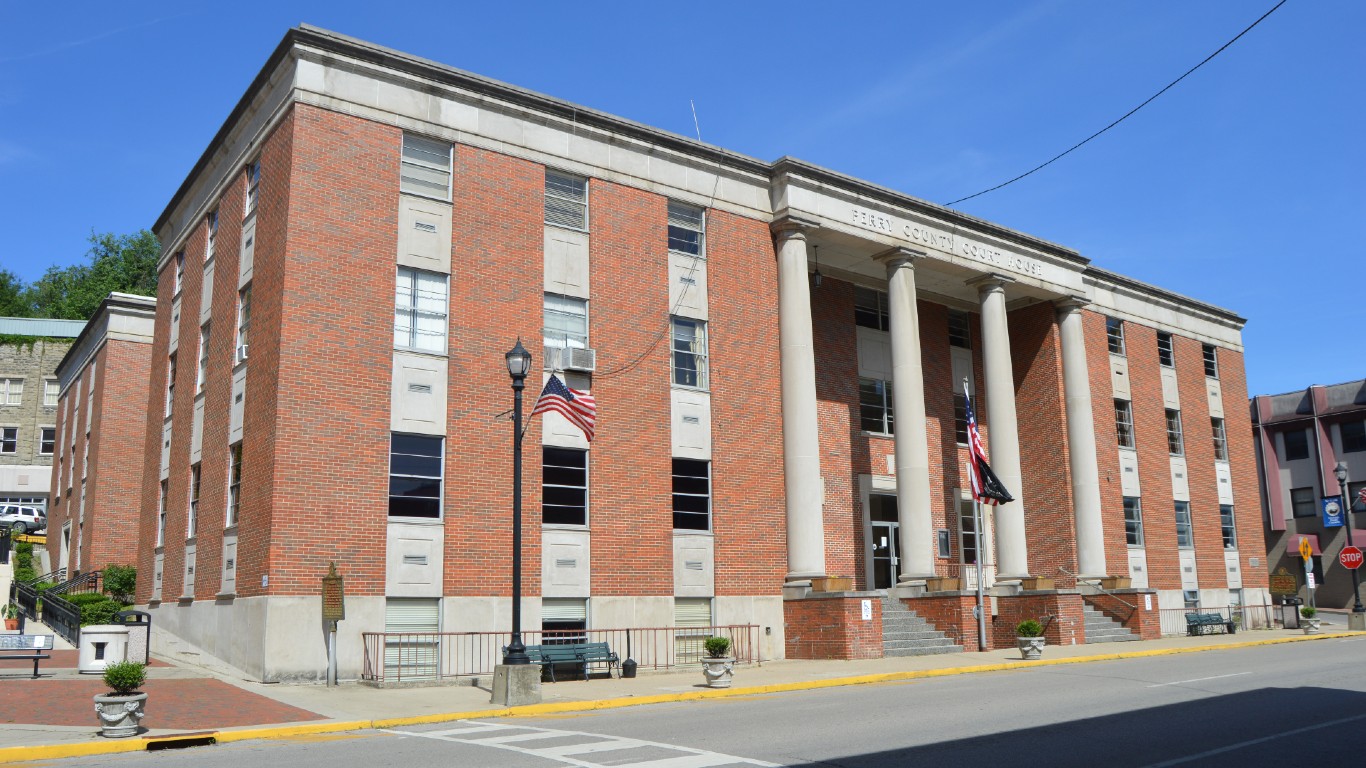
38. Perry County, Kentucky
> Adults binge or heavy drinking: 11.9%
> Driving deaths involving alcohol: 37.5% — 559th highest of 3,081 counties (tied)
> Median household income: $33,640 — 126th lowest of 3,106 counties
> Adults reporting poor or fair health: 29.6% — 126th highest of 3,106 counties
37. Duchesne County, Utah
> Adults binge or heavy drinking: 11.9%
> Driving deaths involving alcohol: 7.1% — 191st lowest of 3,081 counties (tied)
> Median household income: $63,224 — 568th highest of 3,106 counties
> Adults reporting poor or fair health: 18.4% — 1,275th lowest of 3,106 counties
36. Wilkinson County, Mississippi
> Adults binge or heavy drinking: 11.9%
> Driving deaths involving alcohol: 33.3% — 812th highest of 3,081 counties (tied)
> Median household income: $27,313 — 25th lowest of 3,106 counties
> Adults reporting poor or fair health: 36.1% — 14th highest of 3,106 counties
35. Dallas County, Alabama
> Adults binge or heavy drinking: 11.9%
> Driving deaths involving alcohol: 42.1% — 374th highest of 3,081 counties (tied)
> Median household income: $33,845 — 133rd lowest of 3,106 counties
> Adults reporting poor or fair health: 30.1% — 109th highest of 3,106 counties

34. Garfield County, Utah
> Adults binge or heavy drinking: 11.8%
> Driving deaths involving alcohol: 20.0% — 831st lowest of 3,081 counties (tied)
> Median household income: $54,565 — 1,218th highest of 3,106 counties
> Adults reporting poor or fair health: 17.5% — 1,065th lowest of 3,106 counties
33. Juab County, Utah
> Adults binge or heavy drinking: 11.8%
> Driving deaths involving alcohol: 27.3% — 1,456th highest of 3,081 counties (tied)
> Median household income: $61,463 — 655th highest of 3,106 counties
> Adults reporting poor or fair health: 16.1% — 755th lowest of 3,106 counties
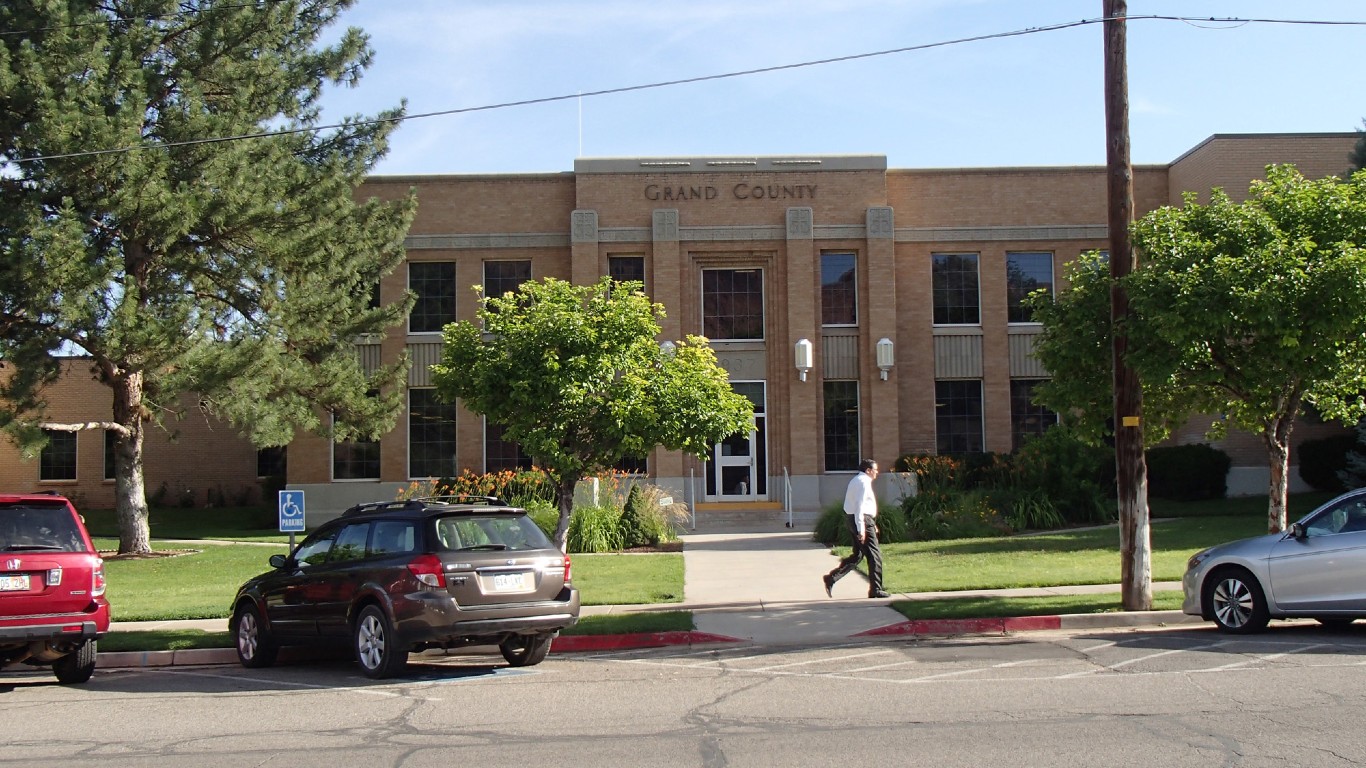
32. Grand County, Utah
> Adults binge or heavy drinking: 11.8%
> Driving deaths involving alcohol: 25.0% — 1,312th lowest of 3,081 counties (tied)
> Median household income: $51,557 — 1,525th lowest of 3,106 counties
> Adults reporting poor or fair health: 15.8% — 685th lowest of 3,106 counties
31. Tooele County, Utah
> Adults binge or heavy drinking: 11.8%
> Driving deaths involving alcohol: 30.4% — 1,138th highest of 3,081 counties (tied)
> Median household income: $74,562 — 233rd highest of 3,106 counties
> Adults reporting poor or fair health: 15.8% — 679th lowest of 3,106 counties

30. Carbon County, Utah
> Adults binge or heavy drinking: 11.8%
> Driving deaths involving alcohol: 15.8% — 555th lowest of 3,081 counties (tied)
> Median household income: $51,158 — 1,489th lowest of 3,106 counties
> Adults reporting poor or fair health: 18.4% — 1,262nd lowest of 3,106 counties
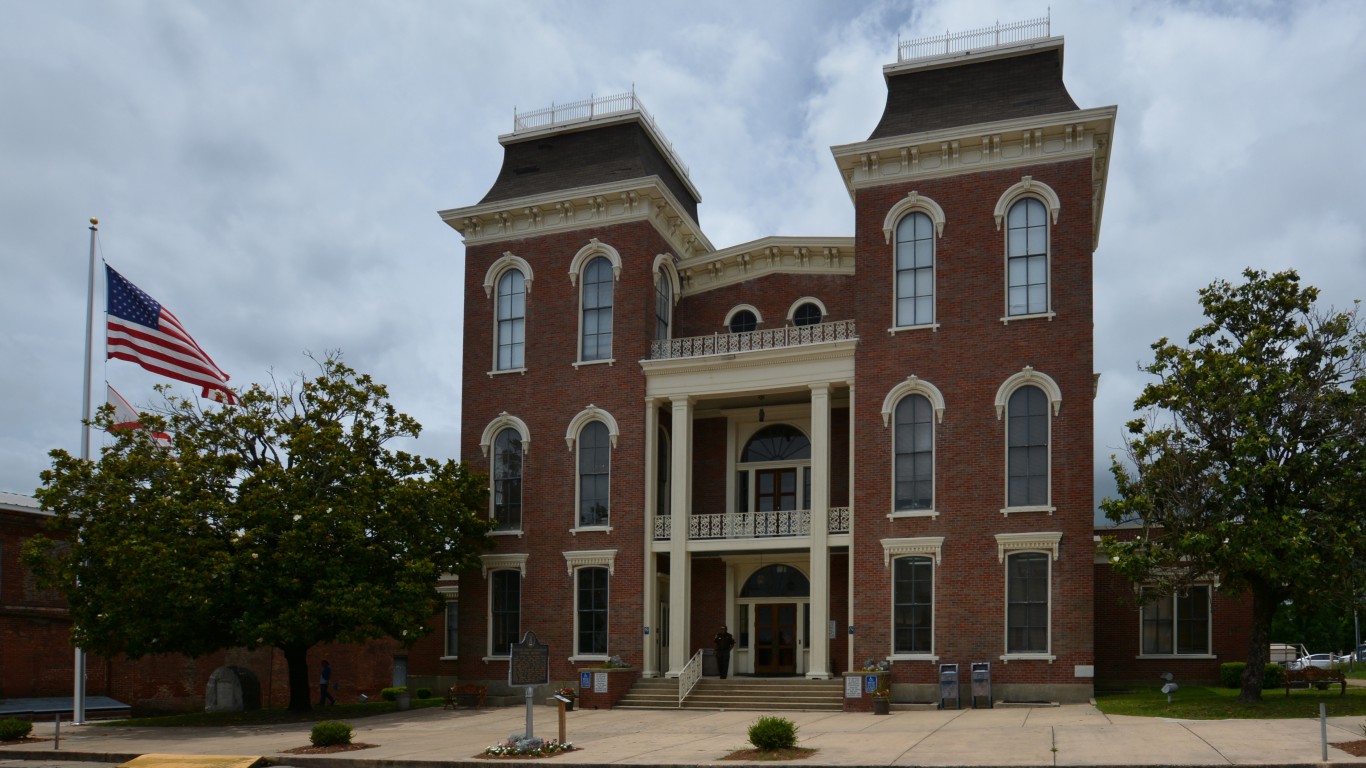
29. Bullock County, Alabama
> Adults binge or heavy drinking: 11.7%
> Driving deaths involving alcohol: 54.5% — 113th highest of 3,081 counties (tied)
> Median household income: $37,785 — 287th lowest of 3,106 counties
> Adults reporting poor or fair health: 31.4% — 65th highest of 3,106 counties
28. Leflore County, Mississippi
> Adults binge or heavy drinking: 11.7%
> Driving deaths involving alcohol: 15.4% — 517th lowest of 3,081 counties (tied)
> Median household income: $26,735 — 18th lowest of 3,106 counties
> Adults reporting poor or fair health: 32.6% — 50th highest of 3,106 counties

27. Issaquena County, Mississippi
> Adults binge or heavy drinking: 11.7%
> Driving deaths involving alcohol: 0.0% reported — the lowest of 3,081 counties (tied)
> Median household income: $24,208 — 6th lowest of 3,106 counties
> Adults reporting poor or fair health: 37.4% — 8th highest of 3,106 counties

26. Hale County, Alabama
> Adults binge or heavy drinking: 11.6%
> Driving deaths involving alcohol: 31.8% — 1,009th highest of 3,081 counties (tied)
> Median household income: $34,046 — 139th lowest of 3,106 counties
> Adults reporting poor or fair health: 29.1% — 149th highest of 3,106 counties

25. Emery County, Utah
> Adults binge or heavy drinking: 11.6%
> Driving deaths involving alcohol: 21.2% — 983rd lowest of 3,081 counties (tied)
> Median household income: $55,554 — 1,116th highest of 3,106 counties
> Adults reporting poor or fair health: 17.2% — 997th lowest of 3,106 counties

24. Lowndes County, Alabama
> Adults binge or heavy drinking: 11.5%
> Driving deaths involving alcohol: 31.0% — 1,085th highest of 3,081 counties (tied)
> Median household income: $30,036 — 54th lowest of 3,106 counties
> Adults reporting poor or fair health: 31.1% — 76th highest of 3,106 counties
23. Sumter County, Alabama
> Adults binge or heavy drinking: 11.4%
> Driving deaths involving alcohol: 33.3% — 812th highest of 3,081 counties (tied)
> Median household income: $24,320 — 7th lowest of 3,106 counties
> Adults reporting poor or fair health: 28.8% — 160th highest of 3,106 counties

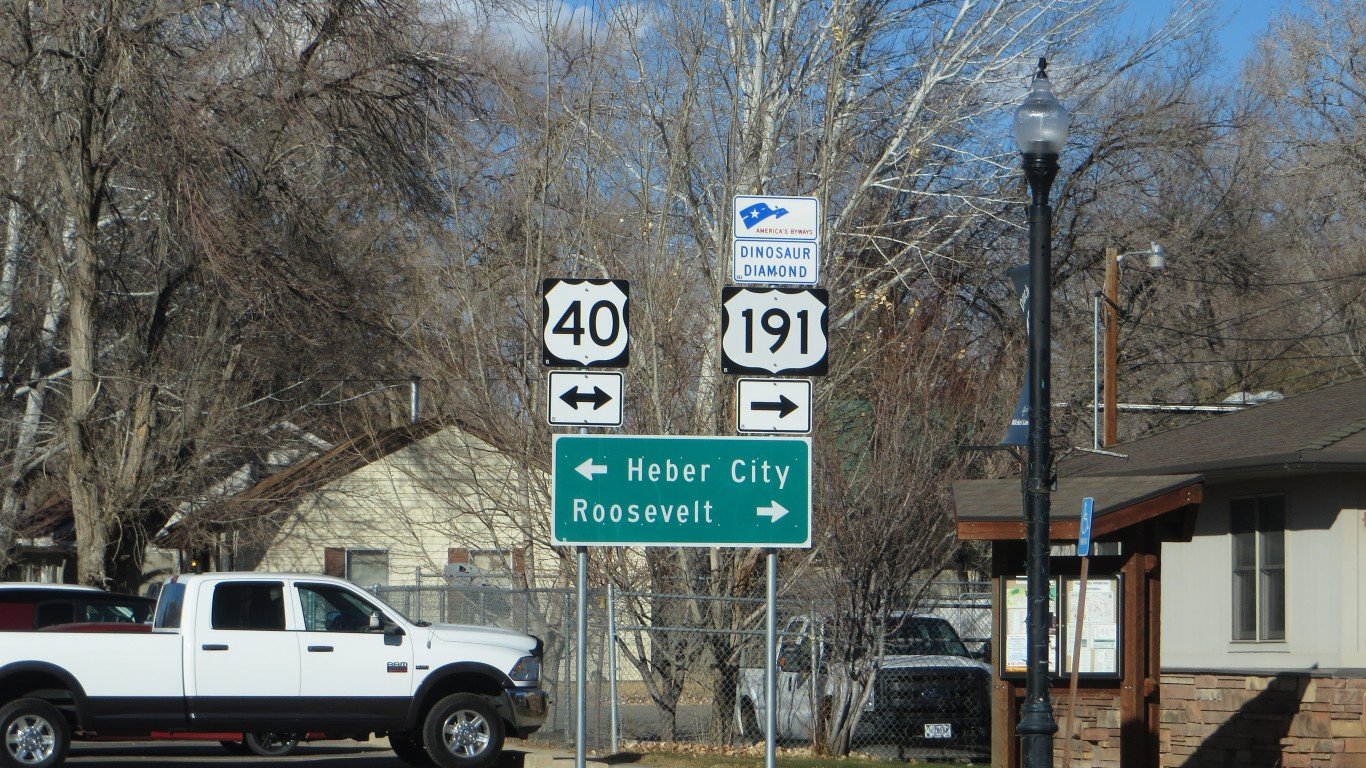
22. Uintah County, Utah
> Adults binge or heavy drinking: 11.3%
> Driving deaths involving alcohol: 42.9% — 339th highest of 3,081 counties (tied)
> Median household income: $65,264 — 452nd highest of 3,106 counties
> Adults reporting poor or fair health: 19.5% — 1,543rd lowest of 3,106 counties
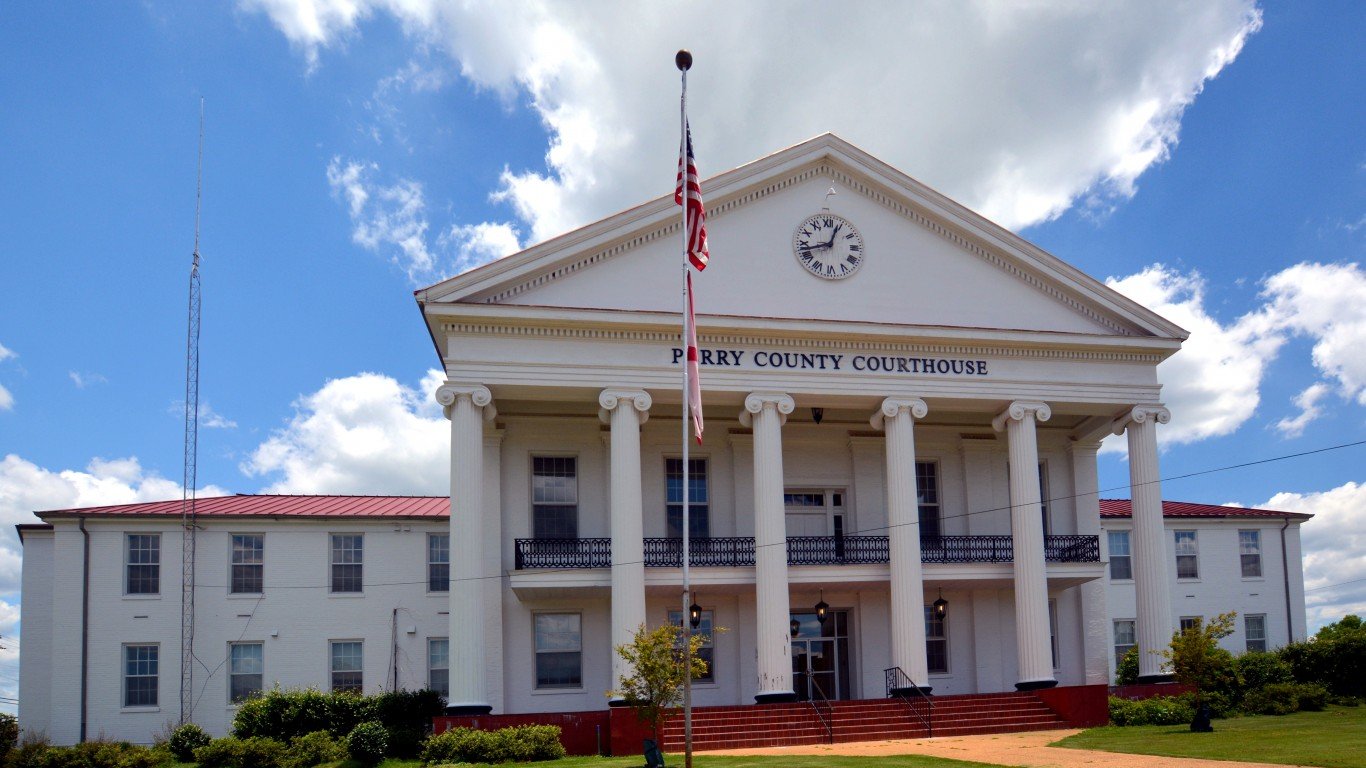
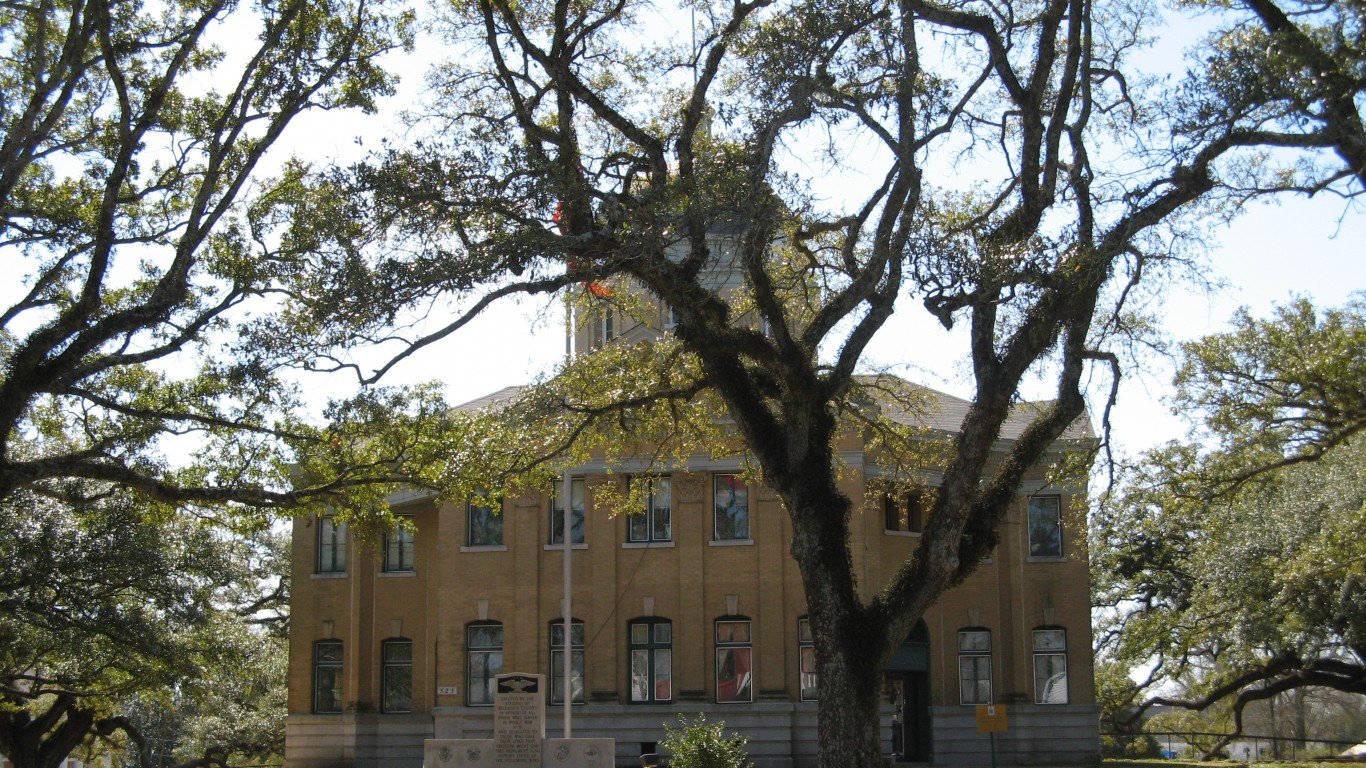
21. Perry County, Alabama
> Adults binge or heavy drinking: 11.3%
> Driving deaths involving alcohol: 61.5% — 67th highest of 3,081 counties (tied)
> Median household income: $23,447 — 4th lowest of 3,106 counties
> Adults reporting poor or fair health: 34.6% — 29th highest of 3,106 counties
20. Piute County, Utah
> Adults binge or heavy drinking: 11.2%
> Driving deaths involving alcohol: 50.0% — 140th highest of 3,081 counties (tied)
> Median household income: $42,813 — 660th lowest of 3,106 counties
> Adults reporting poor or fair health: 19.7% — 1,534th highest of 3,106 counties
19. Sharkey County, Mississippi
> Adults binge or heavy drinking: 11.0%
> Driving deaths involving alcohol: 12.5% — 348th lowest of 3,081 counties (tied)
> Median household income: $29,394 — 44th lowest of 3,106 counties
> Adults reporting poor or fair health: 35.0% — 25th highest of 3,106 counties

18. Macon County, Alabama
> Adults binge or heavy drinking: 10.9%
> Driving deaths involving alcohol: 33.3% — 812th highest of 3,081 counties (tied)
> Median household income: $33,370 — 120th lowest of 3,106 counties
> Adults reporting poor or fair health: 28.0% — 212th highest of 3,106 counties

17. Quitman County, Mississippi
> Adults binge or heavy drinking: 10.9%
> Driving deaths involving alcohol: 40.0% — 436th highest of 3,081 counties (tied)
> Median household income: $25,283 — 14th lowest of 3,106 counties
> Adults reporting poor or fair health: 35.7% — 22nd highest of 3,106 counties

16. Washington County, Utah
> Adults binge or heavy drinking: 10.9%
> Driving deaths involving alcohol: 24.6% — 1,294th lowest of 3,081 counties (tied)
> Median household income: $59,839 — 777th highest of 3,106 counties
> Adults reporting poor or fair health: 15.9% — 702nd lowest of 3,106 counties

15. Iron County, Utah
> Adults binge or heavy drinking: 10.8%
> Driving deaths involving alcohol: 7.4% — 196th lowest of 3,081 counties (tied)
> Median household income: $51,807 — 1,549th highest of 3,106 counties
> Adults reporting poor or fair health: 18.3% — 1,248th lowest of 3,106 counties

14. Wilcox County, Alabama
> Adults binge or heavy drinking: 10.7%
> Driving deaths involving alcohol: 45.5% — 267th highest of 3,081 counties (tied)
> Median household income: $31,014 — 72nd lowest of 3,106 counties
> Adults reporting poor or fair health: 32.1% — 56th highest of 3,106 counties
13. Box Elder County, Utah
> Adults binge or heavy drinking: 10.7%
> Driving deaths involving alcohol: 13.0% — 395th lowest of 3,081 counties (tied)
> Median household income: $62,233 — 626th highest of 3,106 counties
> Adults reporting poor or fair health: 16.1% — 737th lowest of 3,106 counties
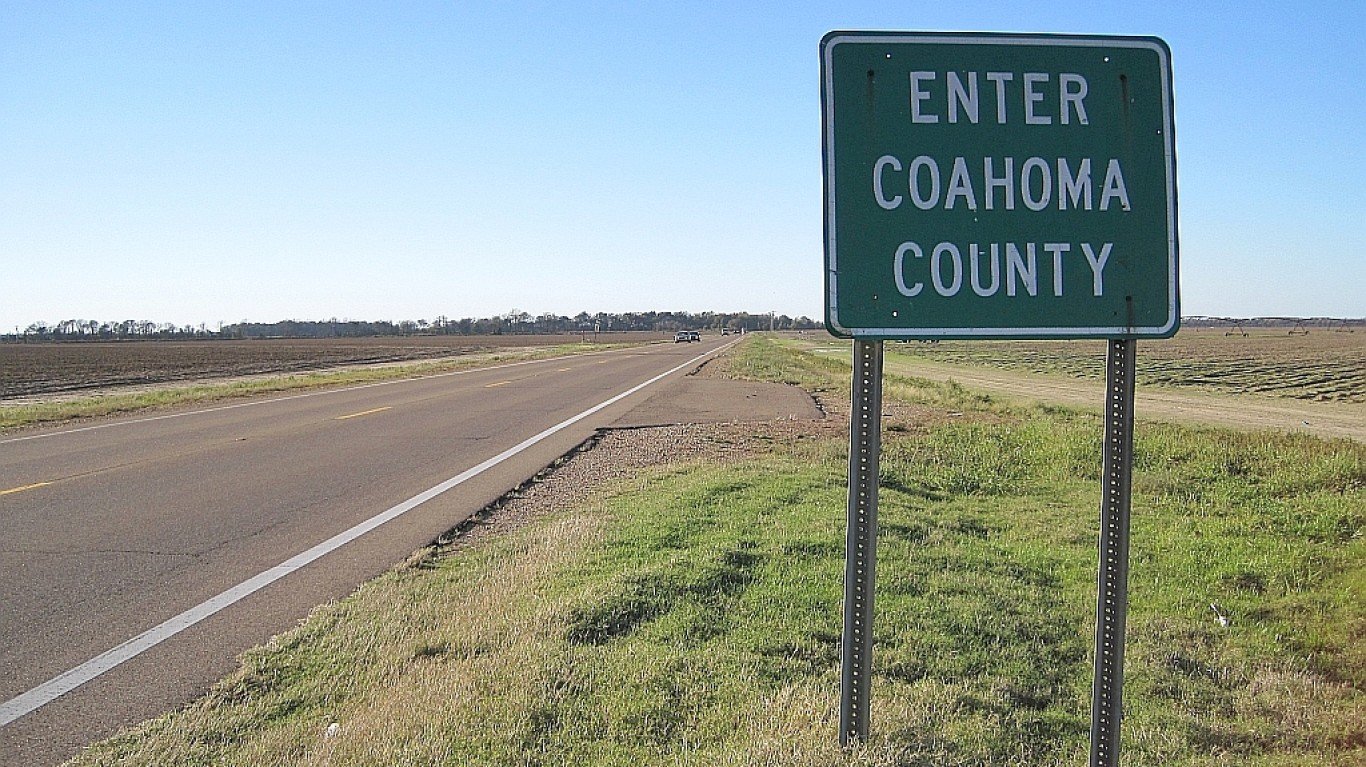
12. Coahoma County, Mississippi
> Adults binge or heavy drinking: 10.7%
> Driving deaths involving alcohol: 15.4% — 517th lowest of 3,081 counties (tied)
> Median household income: $29,121 — 40th lowest of 3,106 counties
> Adults reporting poor or fair health: 33.1% — 46th highest of 3,106 counties

11. San Juan County, Utah
> Adults binge or heavy drinking: 10.6%
> Driving deaths involving alcohol: 34.0% — 789th highest of 3,081 counties (tied)
> Median household income: $45,394 — 887th lowest of 3,106 counties
> Adults reporting poor or fair health: 25.4% — 511th highest of 3,106 counties

10. Humphreys County, Mississippi
> Adults binge or heavy drinking: 10.5%
> Driving deaths involving alcohol: 12.5% — 348th lowest of 3,081 counties (tied)
> Median household income: $28,962 — 37th lowest of 3,106 counties
> Adults reporting poor or fair health: 36.3% — 13th highest of 3,106 counties
9. Greene County, Alabama
> Adults binge or heavy drinking: 10.4%
> Driving deaths involving alcohol: 31.8% — 1,009th highest of 3,081 counties (tied)
> Median household income: $24,145 — 5th lowest of 3,106 counties
> Adults reporting poor or fair health: 34.5% — 33rd highest of 3,106 counties

8. Claiborne County, Mississippi
> Adults binge or heavy drinking: 10.3%
> Driving deaths involving alcohol: 75.0% — 18th highest of 3,081 counties (tied)
> Median household income: $29,338 — 42nd lowest of 3,106 counties
> Adults reporting poor or fair health: 35.8% — 20th highest of 3,106 counties

7. Millard County, Utah
> Adults binge or heavy drinking: 10.3%
> Driving deaths involving alcohol: 20.6% — 927th lowest of 3,081 counties (tied)
> Median household income: $62,242 — 624th highest of 3,106 counties
> Adults reporting poor or fair health: 17.3% — 1,026th lowest of 3,106 counties
6. Jefferson County, Mississippi
> Adults binge or heavy drinking: 10.1%
> Driving deaths involving alcohol: 33.3% — 812th highest of 3,081 counties (tied)
> Median household income: $25,019 — 11th lowest of 3,106 counties
> Adults reporting poor or fair health: 37.9% — 7th highest of 3,106 counties
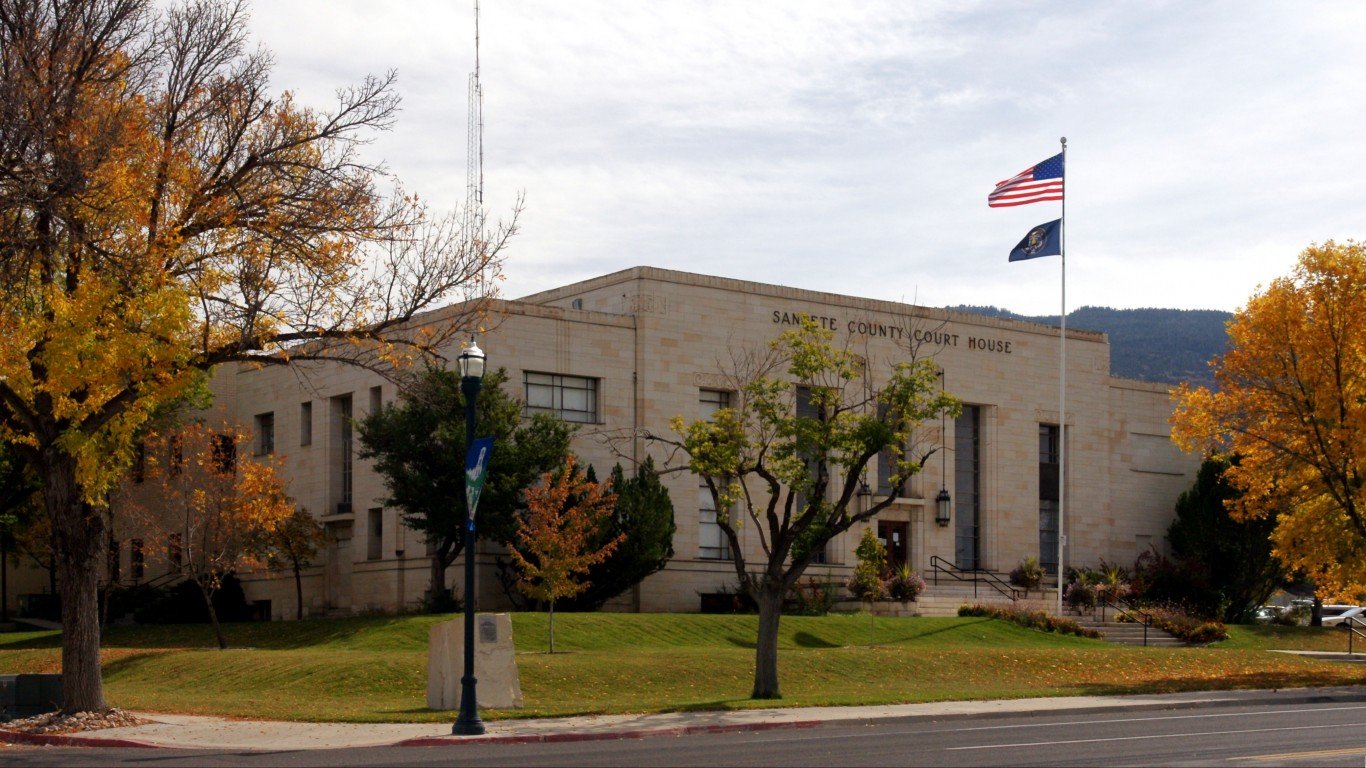
5. Sanpete County, Utah
> Adults binge or heavy drinking: 10.0%
> Driving deaths involving alcohol: 12.5% — 348th lowest of 3,081 counties (tied)
> Median household income: $53,838 — 1,300th highest of 3,106 counties
> Adults reporting poor or fair health: 17.8% — 1,129th lowest of 3,106 counties
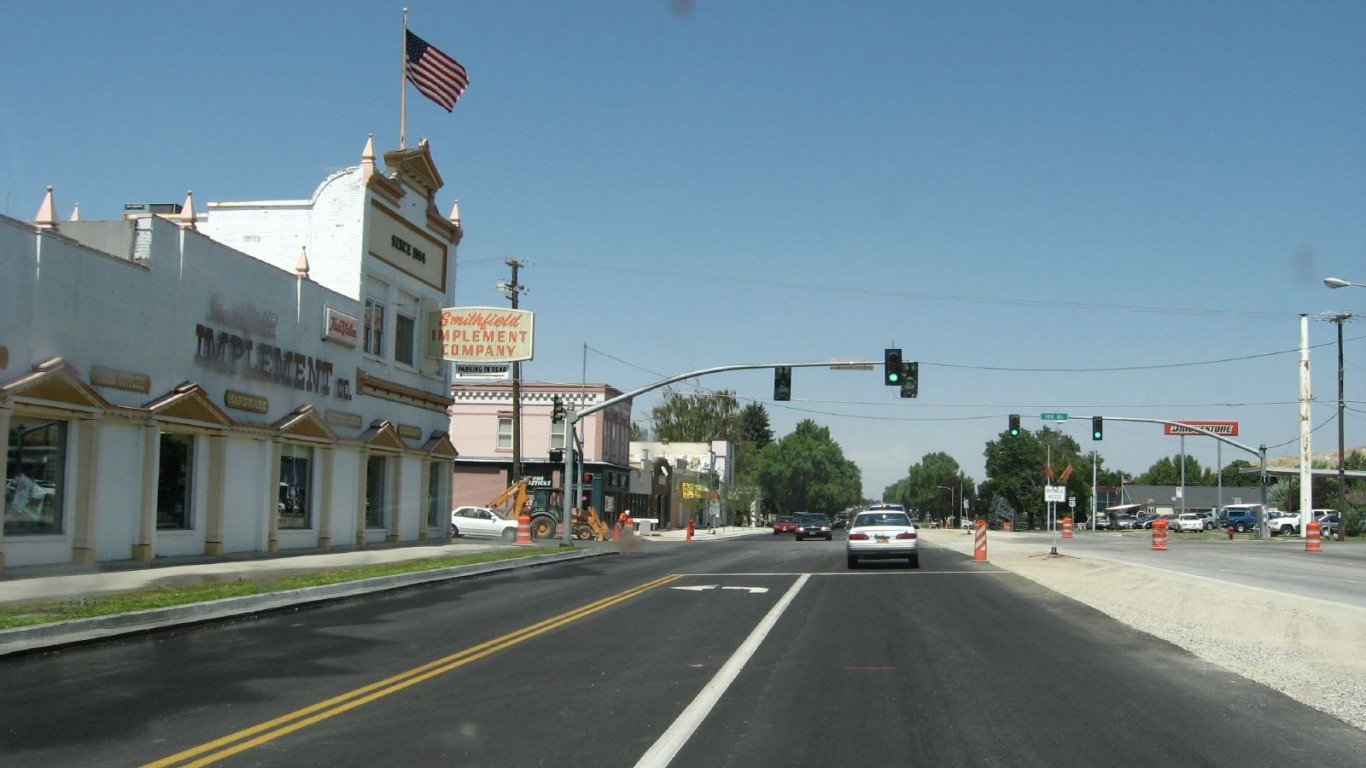
4. Cache County, Utah
> Adults binge or heavy drinking: 10.0%
> Driving deaths involving alcohol: 12.0% — 346th lowest of 3,081 counties (tied)
> Median household income: $59,038 — 831st highest of 3,106 counties
> Adults reporting poor or fair health: 15.0% — 520th lowest of 3,106 counties

3. Davis County, Utah
> Adults binge or heavy drinking: 9.7%
> Driving deaths involving alcohol: 19.8% — 829th lowest of 3,081 counties
> Median household income: $83,310 — 127th highest of 3,106 counties
> Adults reporting poor or fair health: 12.4% — 99th lowest of 3,106 counties
2. Holmes County, Mississippi
> Adults binge or heavy drinking: 9.5%
> Driving deaths involving alcohol: 38.9% — 511th highest of 3,081 counties (tied)
> Median household income: $21,504 — the lowest of 3,106 counties
> Adults reporting poor or fair health: 37.0% — 10th highest of 3,106 counties

1. Utah County, Utah
> Adults binge or heavy drinking: 6.5%
> Driving deaths involving alcohol: 16.8% — 648th lowest of 3,081 counties
> Median household income: $74,665 — 229th highest of 3,106 counties
> Adults reporting poor or fair health: 13.2% — 190th lowest of 3,106 counties
Methodology
To determine America’s least drunk counties, 24/7 Wall St. reviewed rates of excessive drinking from the Robert Wood Johnson Foundation and the University of Wisconsin Population Health Institute joint program’s 2021 County Health Rankings & Roadmaps report.
The rate of excessive drinking is defined as the share of adults who report either binge drinking or heavy drinking in the past 30 days. Binge drinking is defined as a woman consuming more than four drinks or a man consuming more than five drinks in a single occasion. Heavy drinking is defined as a woman consuming more than one drink per day on average or a man consuming more than two drinks per day on average.
While the CHR report is from 2021, excessive drinking rate figures published in the report are from 2018.
Of the 3,220 counties or county equivalents, 3,142 had boundaries that fell within one of the 50 states or the District of Columbia. Counties with a 2019 five-year population estimate from the U.S. Census Bureau of less than 1,000 were excluded.
The remaining 3,106 places were ranked based on the excessive drinking rate. Additional information on the share of driving deaths with alcohol involvement and the share of adults who report fair or poor health are also from the 2021 CHR. Median household income data are five-year estimates from the U.S. Census Bureau’s 2019 American Community Survey.