A lot was going on in 1969, from the moon landing to the Manson murders to the Woodstock music festival to the “Chicago 8” trial, so it’s easy to understand why a relatively small fire on the surface of Cleveland’s Cuyahoga River on June 22 of that year is often overlooked when people talk about the year that defined an era in the United States.
Sparked by a passing rail car, the fire ignited what was already the notoriously polluted river bisecting Cleveland, once a major hub of the iron trade. The river had already caught fire at least a dozen times over the previous century, including a massive blaze in 1952, but this time the fire elicited a different reaction after it was featured in the national press: It became a symbol of the nascent environmental movement.
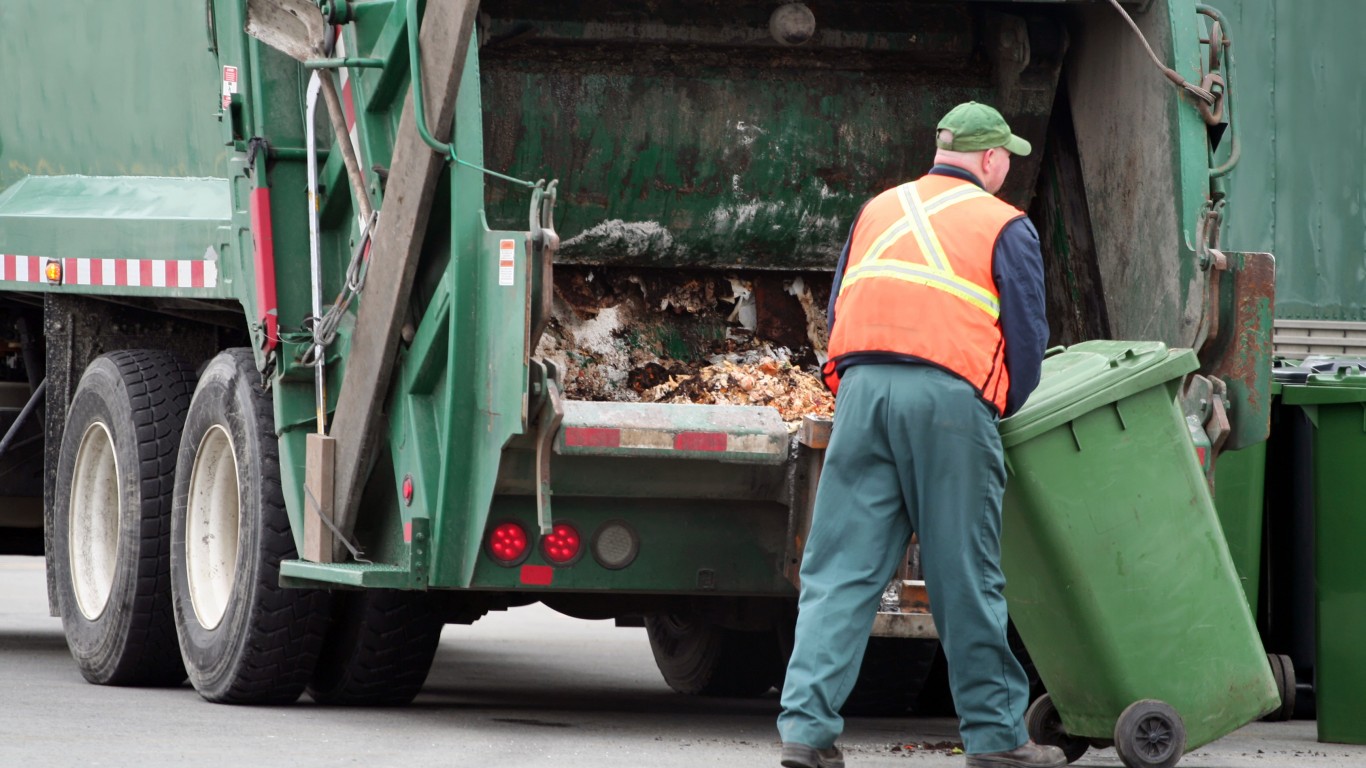
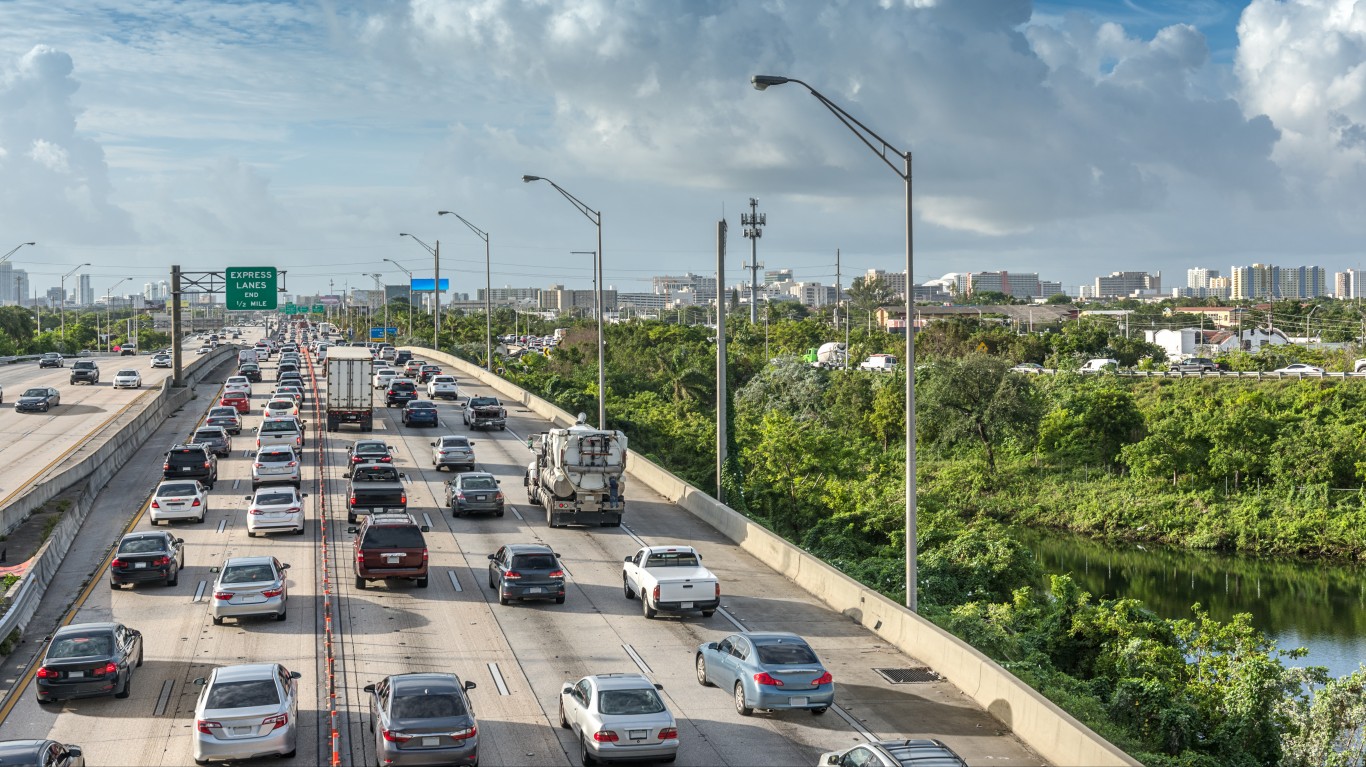
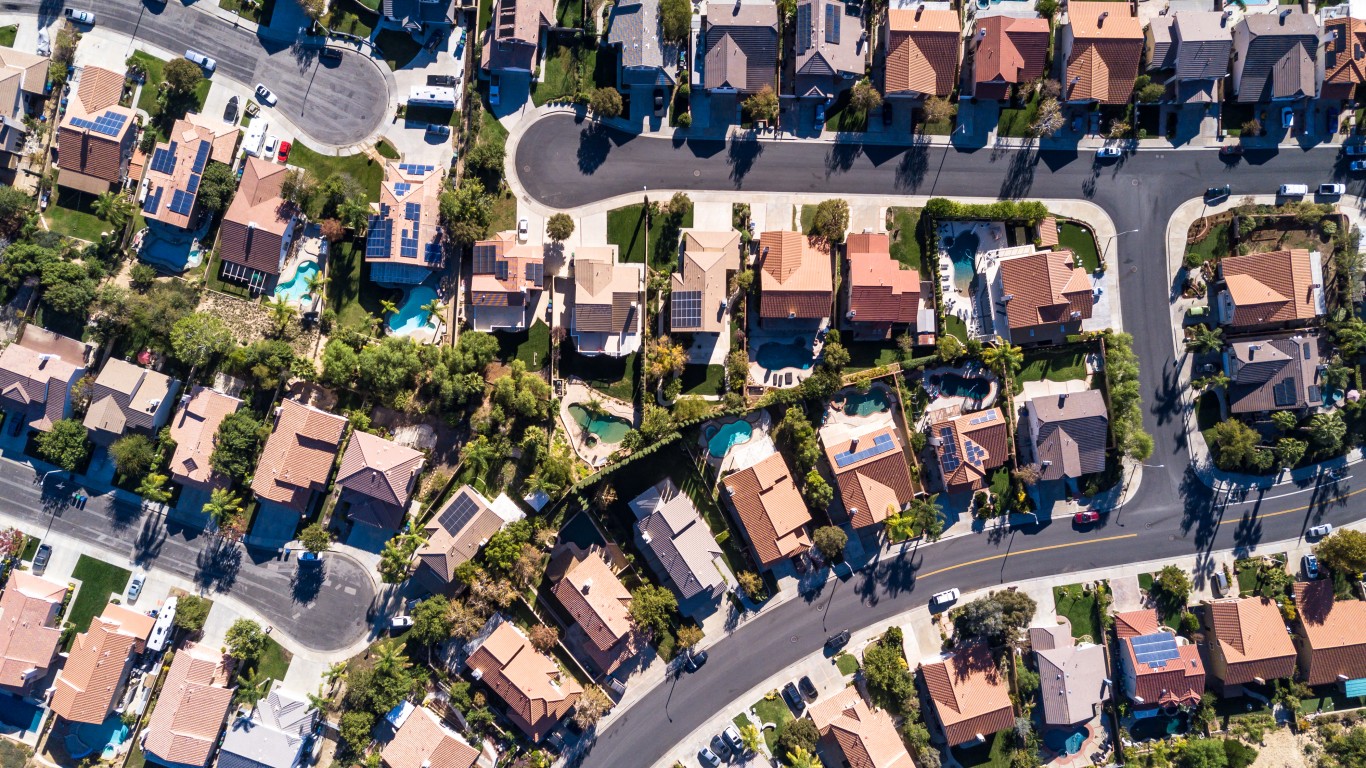
While American has come a long way from the days of smog-choked cities and burning rivers, pollution persists in various ways. Cities can suffer from poor air and water quality, as well as overcrowded, trash-strewn, vermin-infested living conditions that drive down qualities of life, and lifespans, especially in poorer and marginalized communities. (These issues are hardly unique to the U.S. These are the world’s most stressed-out cities.)
For understandable reasons, the dirtiest cities tend to be the most crowded ones. But determining which cities are worse than others depends on different factors, such as the level of air pollution caused by local industries. A city might rank high on effective waste disposal but get low marks due to poor living conditions.
To identify America’s dirtiest cities, 24/7 Tempo reviewed a ranking created by LawnStarter, a lawn care start-up that frequently conducts research into city and state amenities. The site compared the country’s 200 largest cities across 20 key metrics, encompassing indicators of pollution, living conditions, resident satisfaction with city cleanliness, and infrastructure factors to assign each one an overall score. (These are America’s least and most environmentally friendly states.)
To that score and the ranking of each city of resident satisfaction with city cleanliness, 24/7 Tempo added each municipality’s average daily PM2.5 (the concentration of particulate matter with a diameter of less than 2.5 micrometers) per cubic meter of air, drawn from the County Health Rankings and Roadmaps, a collaboration between the University of Wisconsin Population Health Institute and the Robert Woods Johnson Foundation. Total population is from the U.S. Census Bureau’s 2019 American Community Survey five-year estimates.
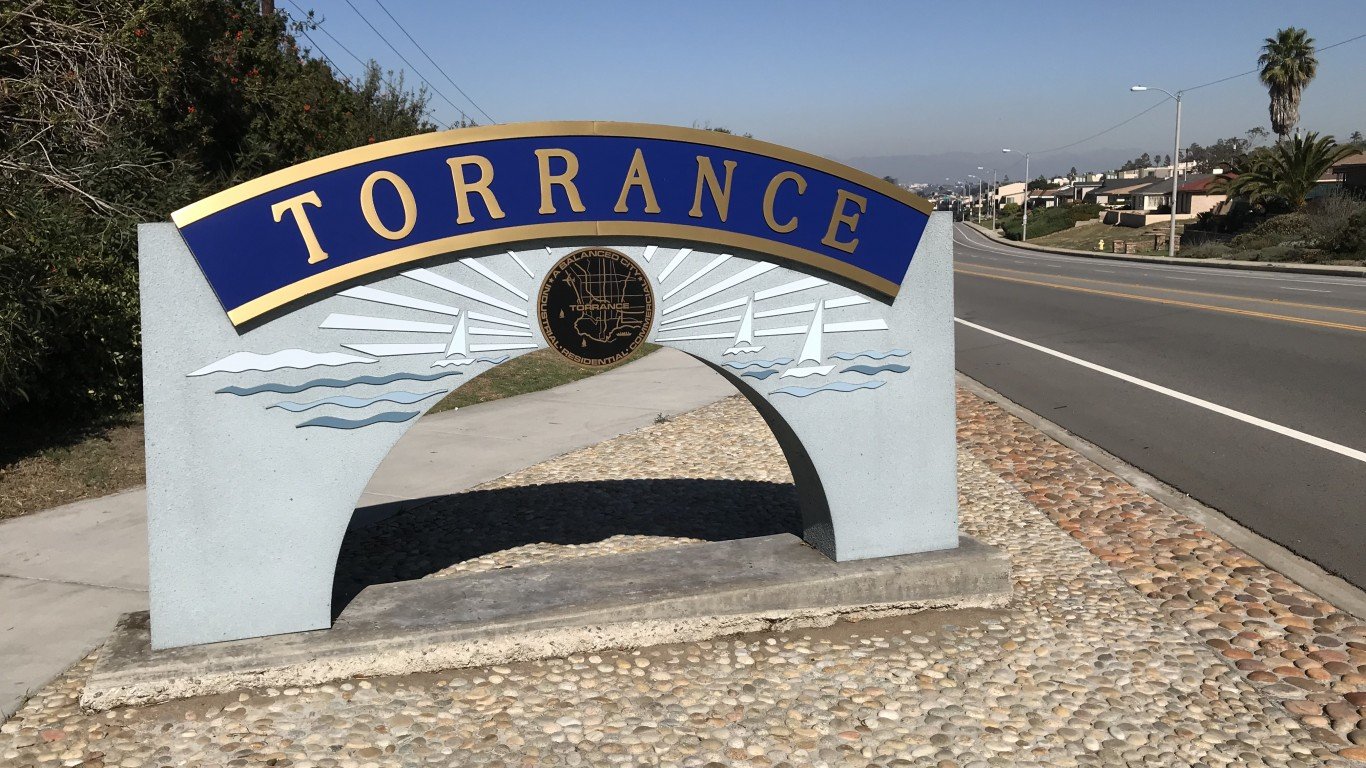
50. Torrance, California
> LawnStarter score: 36.5
> Resident satisfaction with city cleanliness: #156 worst out of 200 cities
> Avg daily PM2.5 (county): 12 micrograms per cubic meter
> Population: 145,492
49. Lancaster, California
> LawnStarter score: 36.6 (tie)
> Resident satisfaction with city cleanliness: #156 worst out of 200 cities
> Avg daily PM2.5 (county): 12 micrograms per cubic meter
> Population: 159,028
48. Arlington, Texas
> LawnStarter score: 36.6 (tie)
> Resident satisfaction with city cleanliness: #91 worst out of 200 cities
> Avg daily PM2.5 (county): 8.8 micrograms per cubic meter
> Population: 395,477
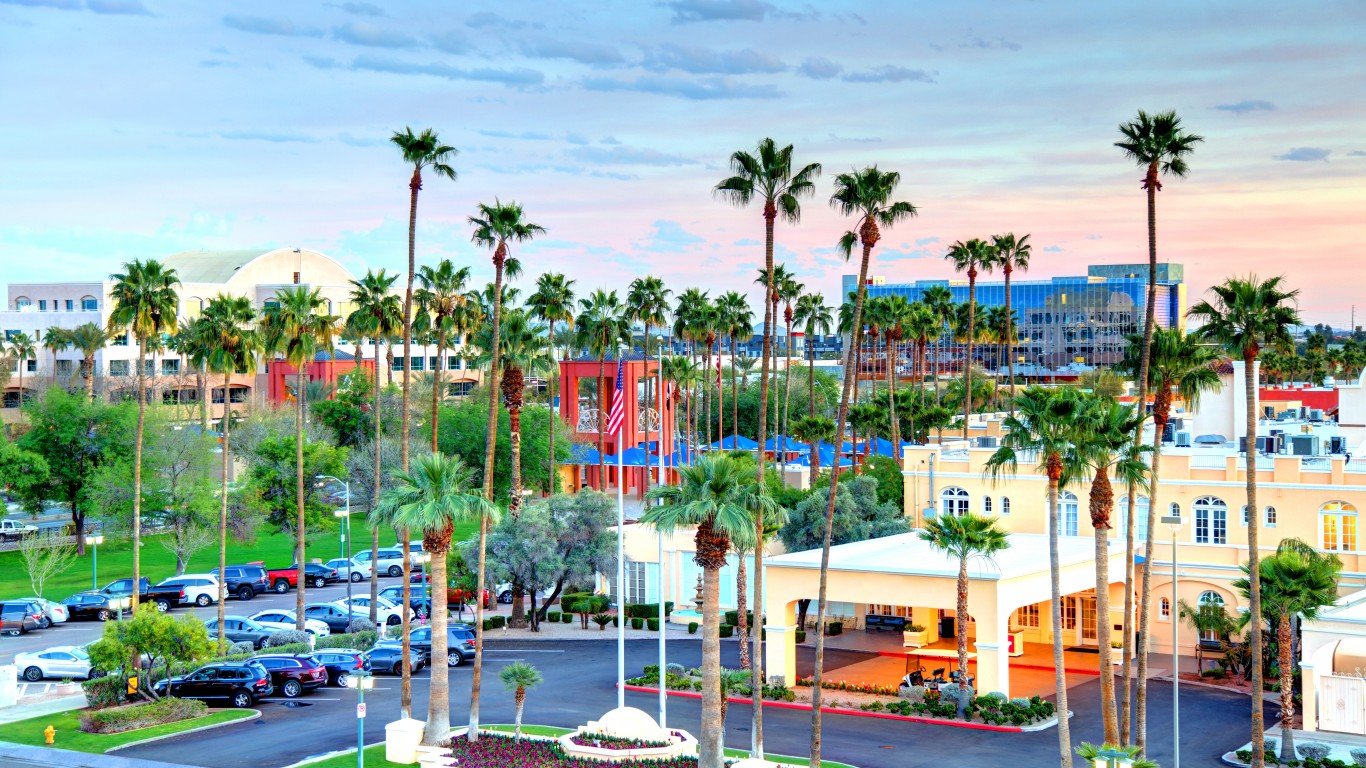
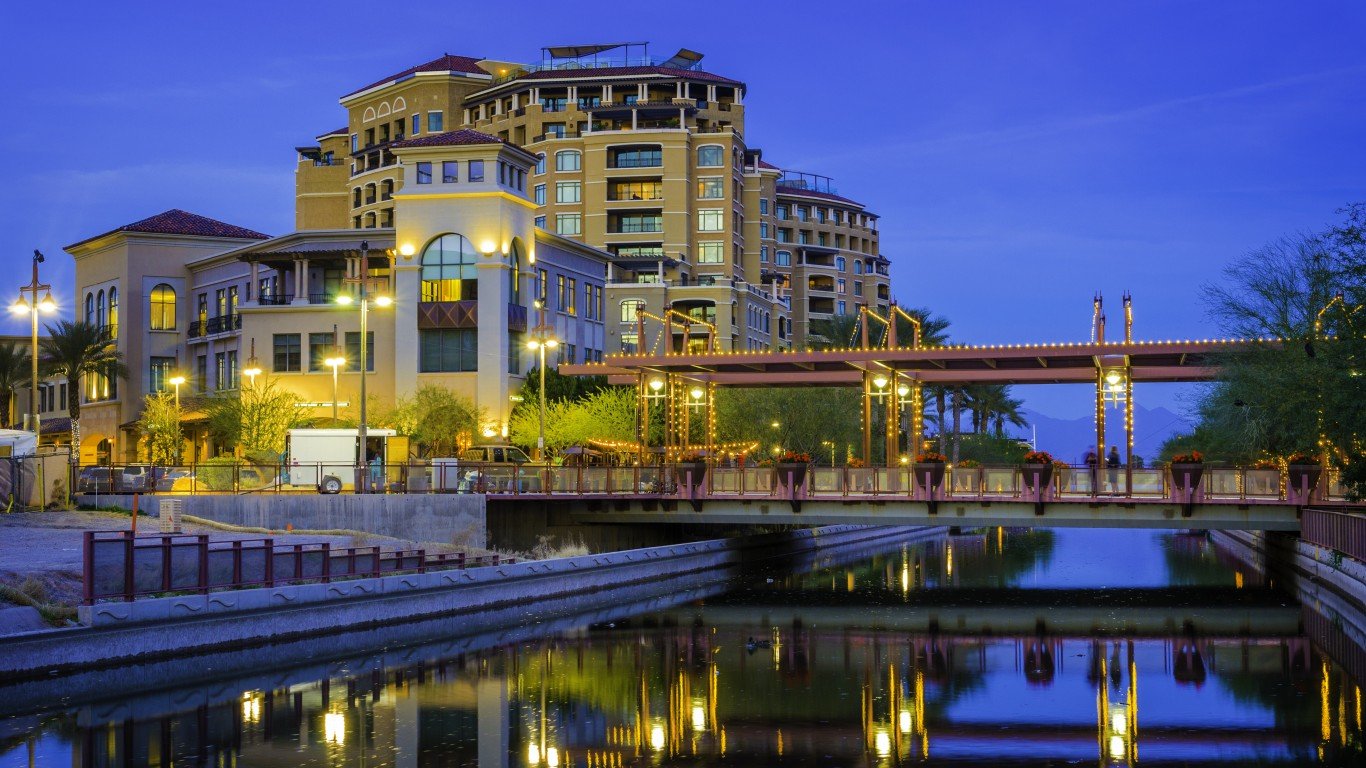
47. Chandler, Arizona
> LawnStarter score: 36.7
> Resident satisfaction with city cleanliness: #142 worst out of 200 cities
> Avg daily PM2.5 (county): 9.5 micrograms per cubic meter
> Population: 252,692
46. Newport News, Virginia
> LawnStarter score: 37.3 (tie)
> Resident satisfaction with city cleanliness: #4 worst out of 200 cities
> Avg daily PM2.5 (county): 7.8 micrograms per cubic meter
> Population: 179,673
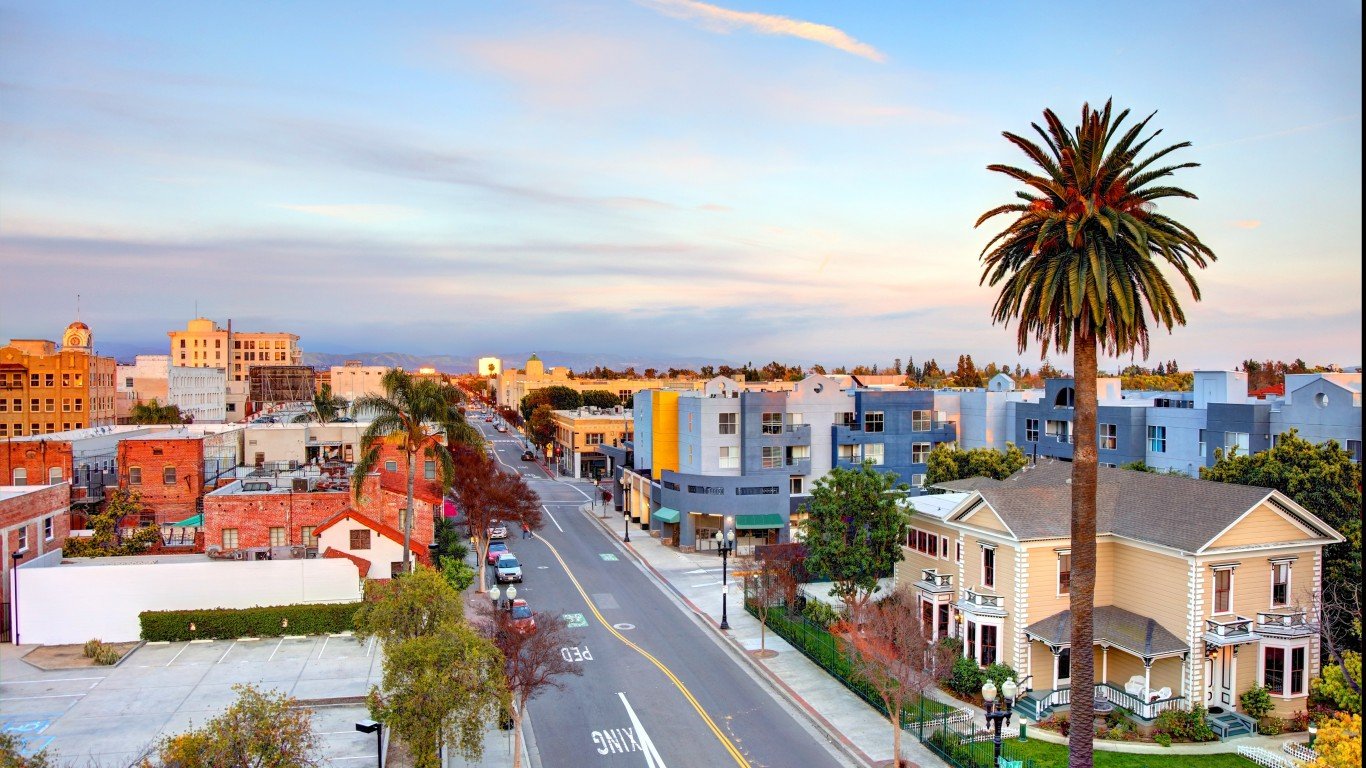
45. Modesto, California
> LawnStarter score: 37.3 (tie)
> Resident satisfaction with city cleanliness: #10 worst out of 200 cities
> Avg daily PM2.5 (county): 12.6 micrograms per cubic meter
> Population: 212,616
44. Santa Ana, California
> LawnStarter score: 37.6
> Resident satisfaction with city cleanliness: #35 worst out of 200 cities
> Avg daily PM2.5 (county): 9.4 micrograms per cubic meter
> Population: 332,794
43. Stockton, California
> LawnStarter score: 38.5
> Resident satisfaction with city cleanliness: #5 worst out of 200 cities
> Avg daily PM2.5 (county): 14.1 micrograms per cubic meter
> Population: 309,228

42. Philadelphia, Pennsylvania
> LawnStarter score: 38.8
> Resident satisfaction with city cleanliness: #19 worst out of 200 cities
> Avg daily PM2.5 (county): 10.5 micrograms per cubic meter
> Population: 1,579,075
41. Pomona, California
> LawnStarter score: 38.9 (tie)
> Resident satisfaction with city cleanliness: #156 worst out of 200 cities
> Avg daily PM2.5 (county): 12 micrograms per cubic meter
> Population: 152,209
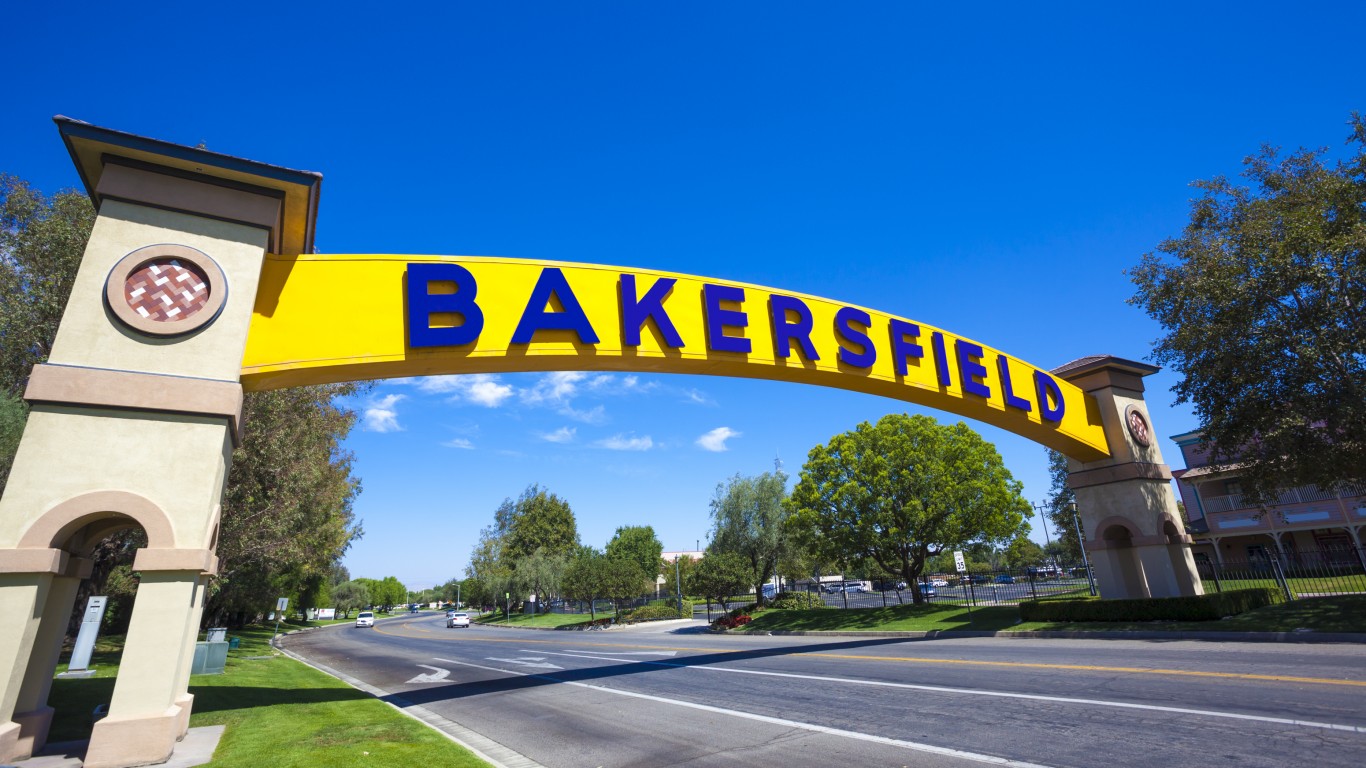
40. Bakersfield, California
> LawnStarter score: 38.9 (tie)
> Resident satisfaction with city cleanliness: #9 worst out of 200 cities
> Avg daily PM2.5 (county): 16 micrograms per cubic meter
> Population: 377,917
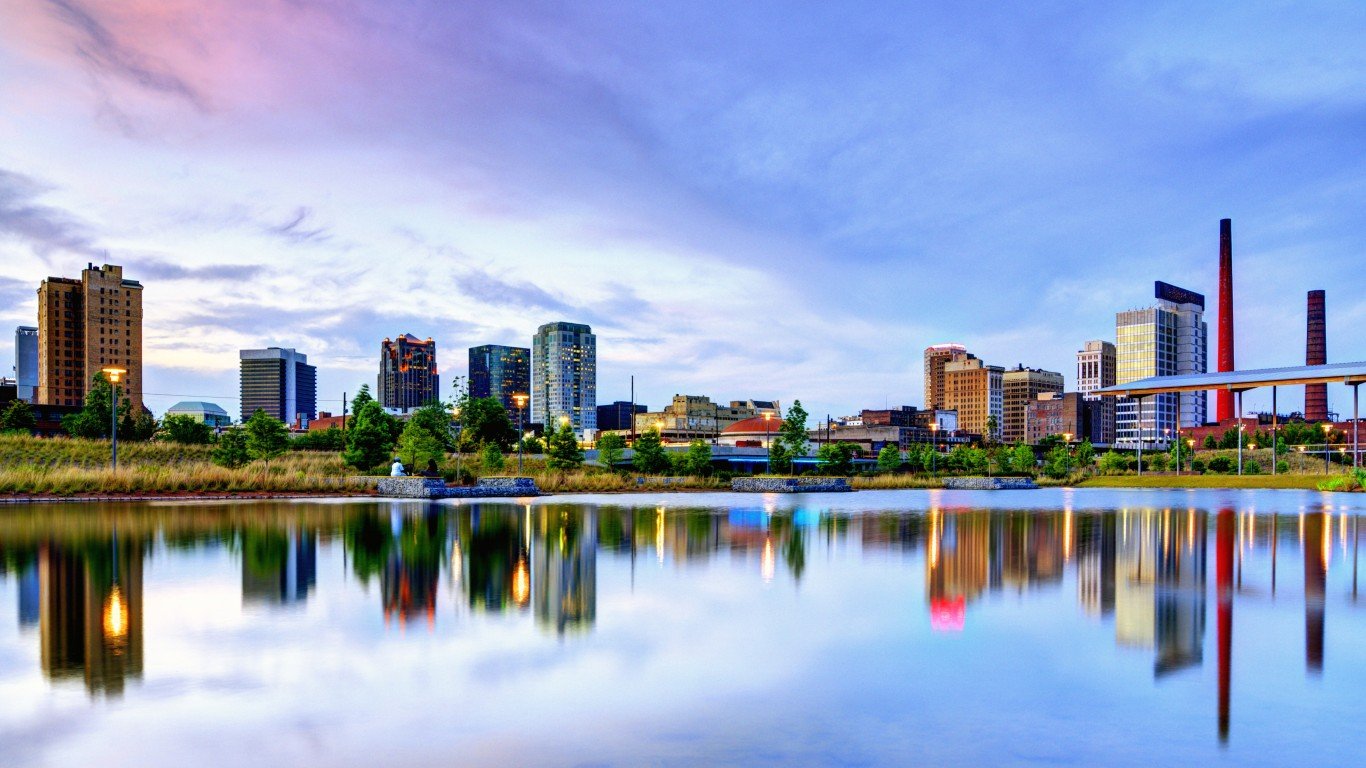
39. Birmingham, Alabama
> LawnStarter score: 39.3
> Resident satisfaction with city cleanliness: #79 worst out of 200 cities
> Avg daily PM2.5 (county): 10.8 micrograms per cubic meter
> Population: 212,297
38. Pasadena, Texas
> LawnStarter score: 39.5 (tie)
> Resident satisfaction with city cleanliness: #156 worst out of 200 cities
> Avg daily PM2.5 (county): 10.1 micrograms per cubic meter
> Population: 153,350
37. Peoria, Arizona
> LawnStarter score: 39.5 (tie)
> Resident satisfaction with city cleanliness: #120 worst out of 200 cities
> Avg daily PM2.5 (county): 9.5 micrograms per cubic meter
> Population: 168,196
36. Scottsdale, Arizona
> LawnStarter score: 39.6
> Resident satisfaction with city cleanliness: #99 worst out of 200 cities
> Avg daily PM2.5 (county): 9.5 micrograms per cubic meter
> Population: 250,602
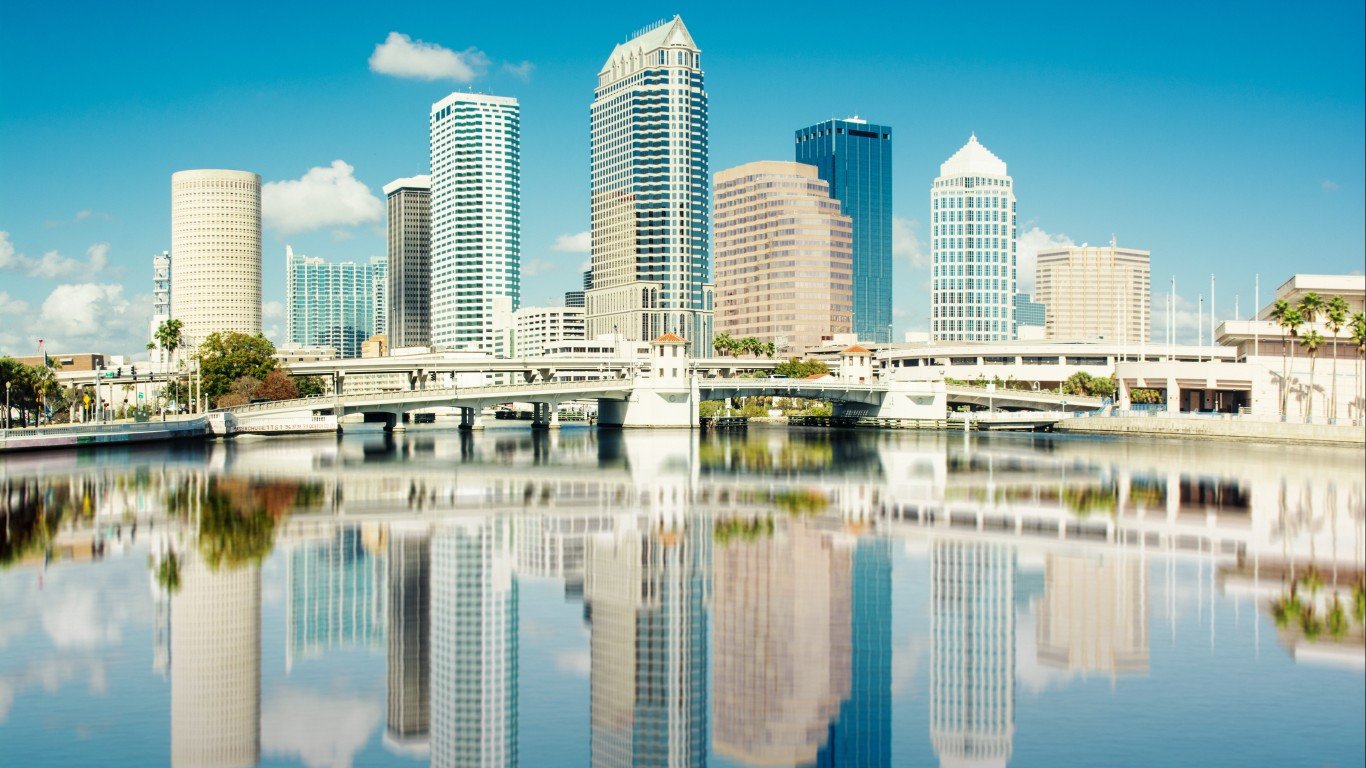
35. Tampa, Florida
> LawnStarter score: 40.1 (tie)
> Resident satisfaction with city cleanliness: #105 worst out of 200 cities
> Avg daily PM2.5 (county): 8.6 micrograms per cubic meter
> Population: 387,916
34. Miami, Florida
> LawnStarter score: 40.1 (tie)
> Resident satisfaction with city cleanliness: #50 worst out of 200 cities
> Avg daily PM2.5 (county): 7.7 micrograms per cubic meter
> Population: 454,279
33. Aurora, Colorado
> LawnStarter score: 40.5
> Resident satisfaction with city cleanliness: #51 worst out of 200 cities
> Avg daily PM2.5 (county): 9.2 micrograms per cubic meter
> Population: 369,111

32. Tempe, Arizona
> LawnStarter score: 40.6
> Resident satisfaction with city cleanliness: #93 worst out of 200 cities
> Avg daily PM2.5 (county): 9.5 micrograms per cubic meter
> Population: 187,454
31. Riverside, California
> LawnStarter score: 40.8
> Resident satisfaction with city cleanliness: #44 worst out of 200 cities
> Avg daily PM2.5 (county): 14.1 micrograms per cubic meter
> Population: 326,414
30. Henderson, Nevada
> LawnStarter score: 41
> Resident satisfaction with city cleanliness: #60 worst out of 200 cities
> Avg daily PM2.5 (county): 10.8 micrograms per cubic meter
> Population: 300,116
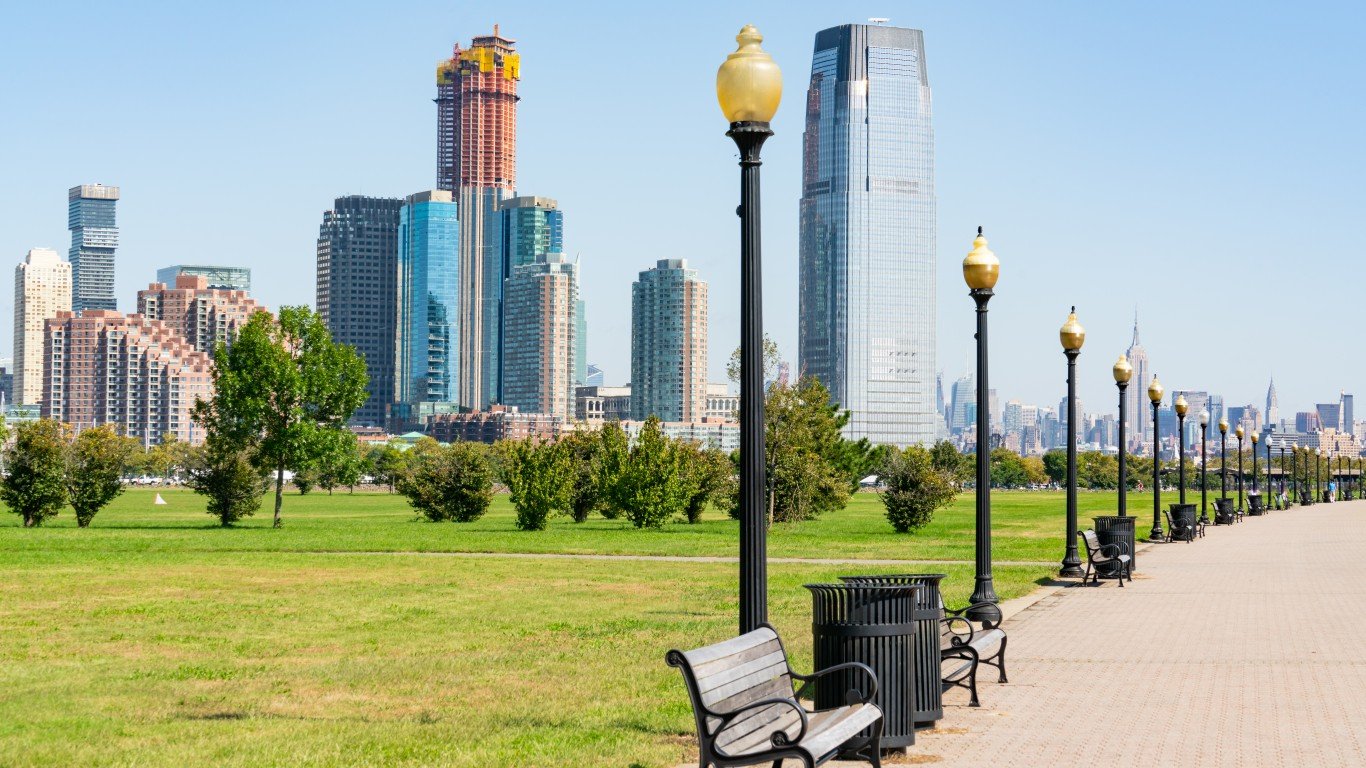
29. Jersey City, New Jersey
> LawnStarter score: 41.3
> Resident satisfaction with city cleanliness: #25 worst out of 200 cities
> Avg daily PM2.5 (county): 9.6 micrograms per cubic meter
> Population: 261,940

28. San Francisco, California
> LawnStarter score: 41.6
> Resident satisfaction with city cleanliness: #24 worst out of 200 cities
> Avg daily PM2.5 (county): 7.6 micrograms per cubic meter
> Population: 874,961
27. Akron, Ohio
> LawnStarter score: 41.7
> Resident satisfaction with city cleanliness: #29 worst out of 200 cities
> Avg daily PM2.5 (county): 10.3 micrograms per cubic meter
> Population: 198,051
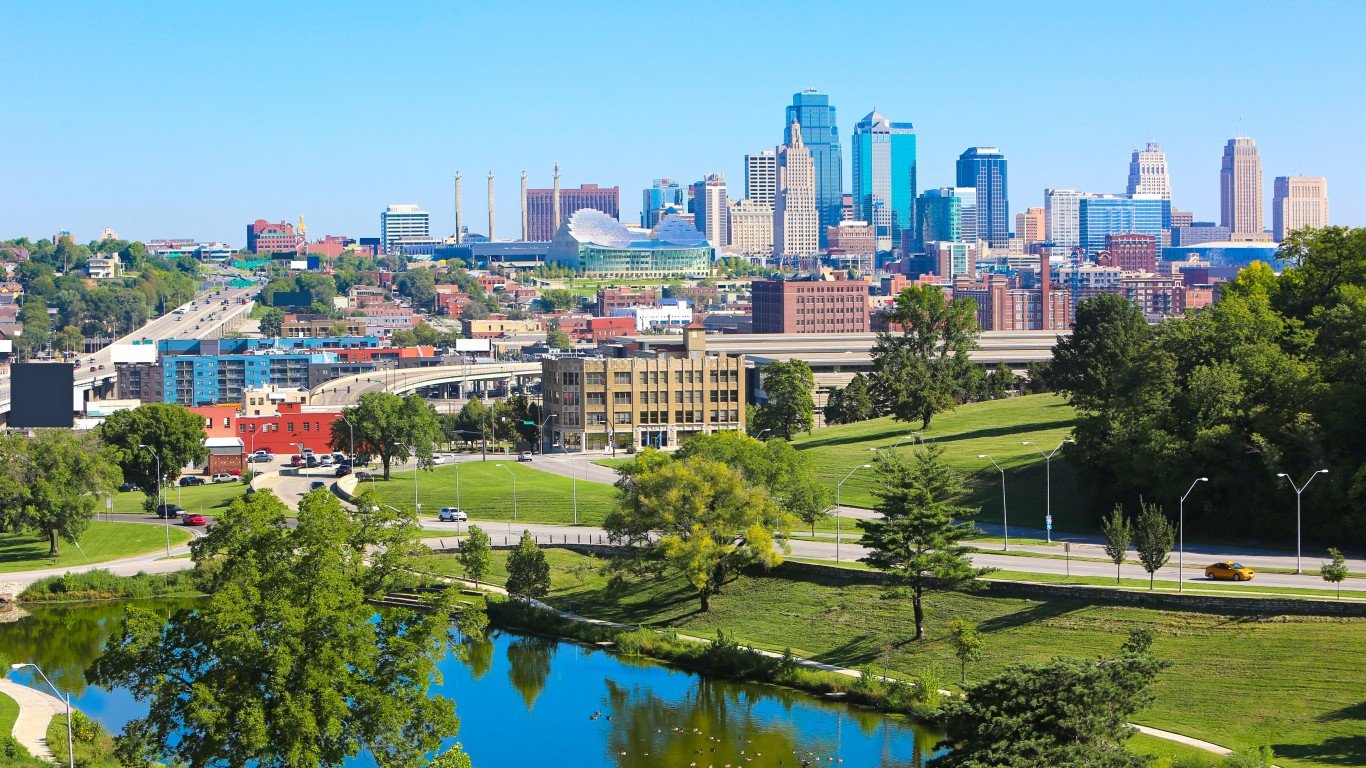
26. Kansas City, Kansas
> LawnStarter score: 42.1
> Resident satisfaction with city cleanliness: #67 worst out of 200 cities
> Avg daily PM2.5 (county): 8 micrograms per cubic meter
> Population: 152,522
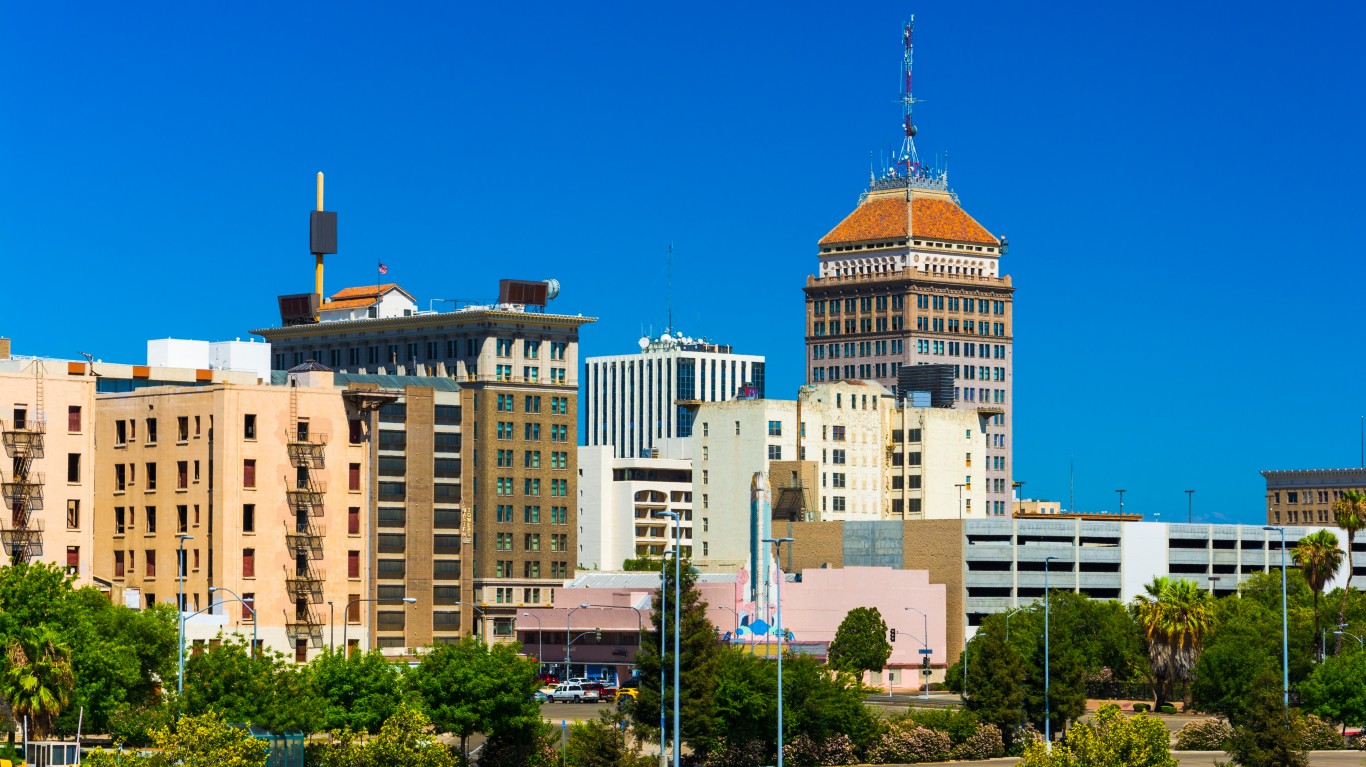
25. Fresno, California
> LawnStarter score: 42.5
> Resident satisfaction with city cleanliness: #6 worst out of 200 cities
> Avg daily PM2.5 (county): 14.4 micrograms per cubic meter
> Population: 525,010
24. Santa Clarita, California
> LawnStarter score: 42.7
> Resident satisfaction with city cleanliness: #139 worst out of 200 cities
> Avg daily PM2.5 (county): 12 micrograms per cubic meter
> Population: 213,411
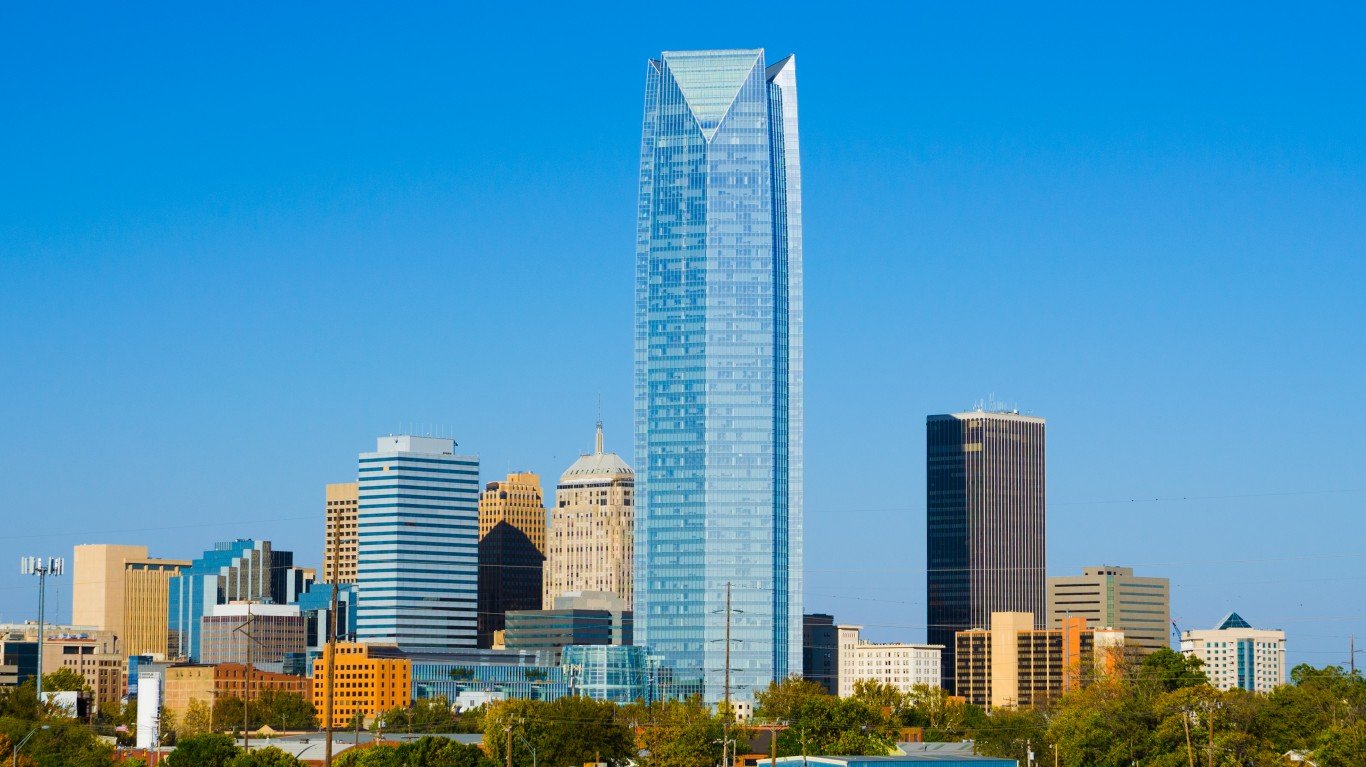
23. Oklahoma City, Oklahoma
> LawnStarter score: 42.8
> Resident satisfaction with city cleanliness: #111 worst out of 200 cities
> Avg daily PM2.5 (county): 8.4 micrograms per cubic meter
> Population: 643,692
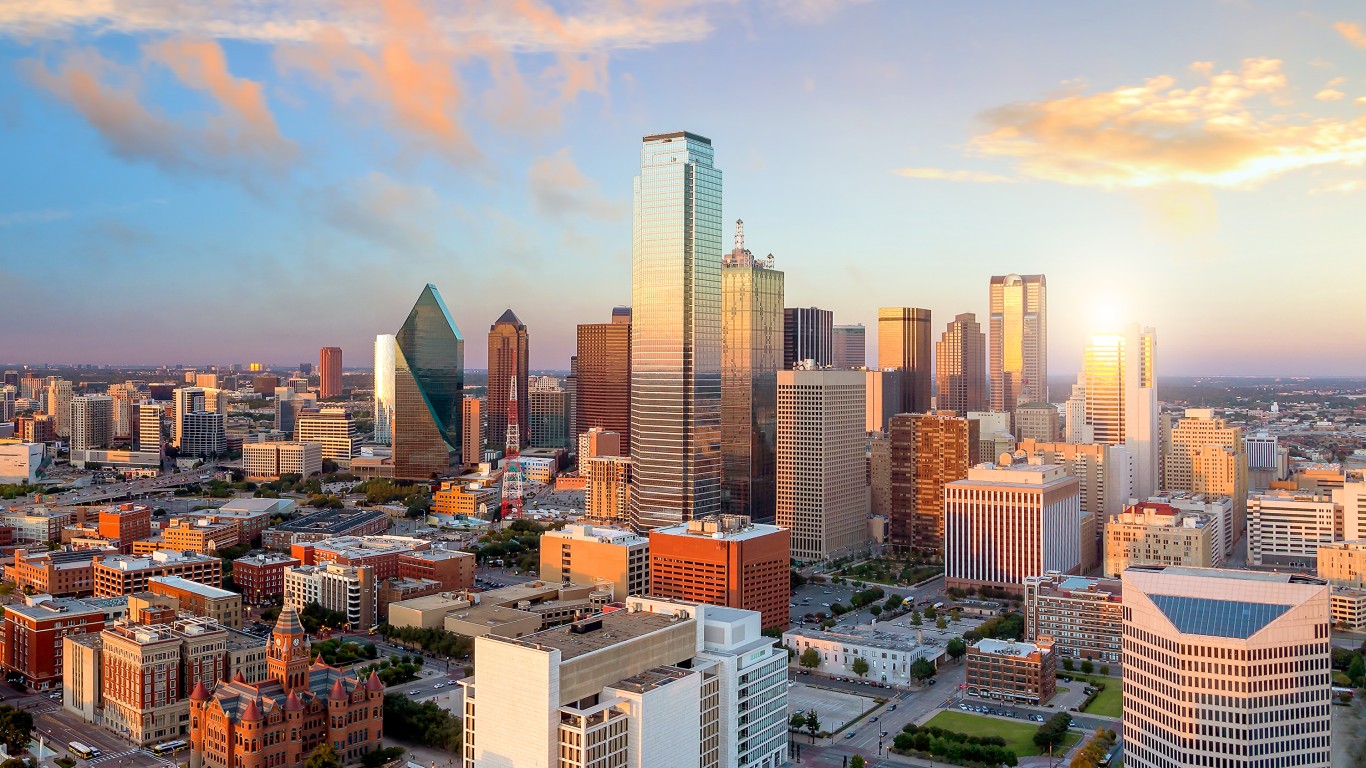
22. Dallas, Texas
> LawnStarter score: 43
> Resident satisfaction with city cleanliness: #47 worst out of 200 cities
> Avg daily PM2.5 (county): 8.8 micrograms per cubic meter
> Population: 1,330,612
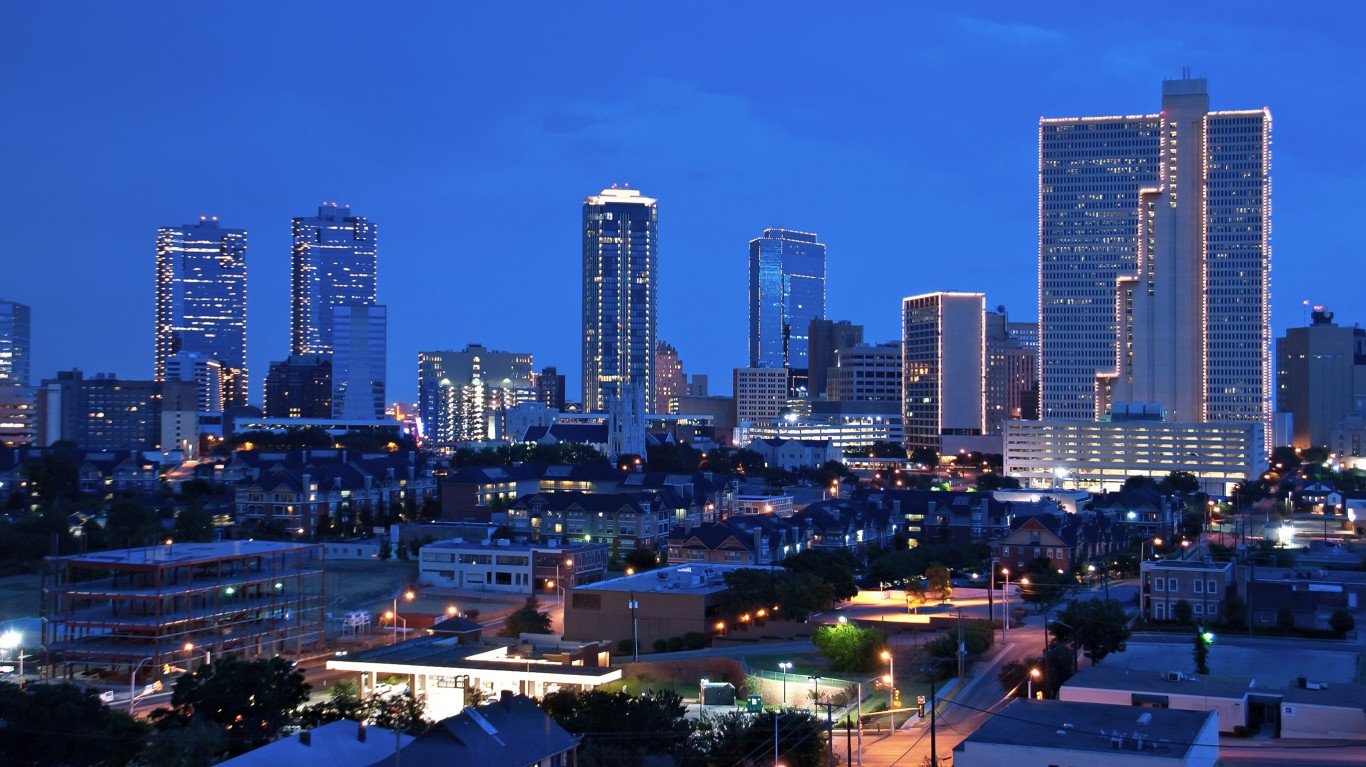
21. Fort Worth, Texas
> LawnStarter score: 43.2
> Resident satisfaction with city cleanliness: #18 worst out of 200 cities
> Avg daily PM2.5 (county): 8.5 micrograms per cubic meter
> Population: 874,401
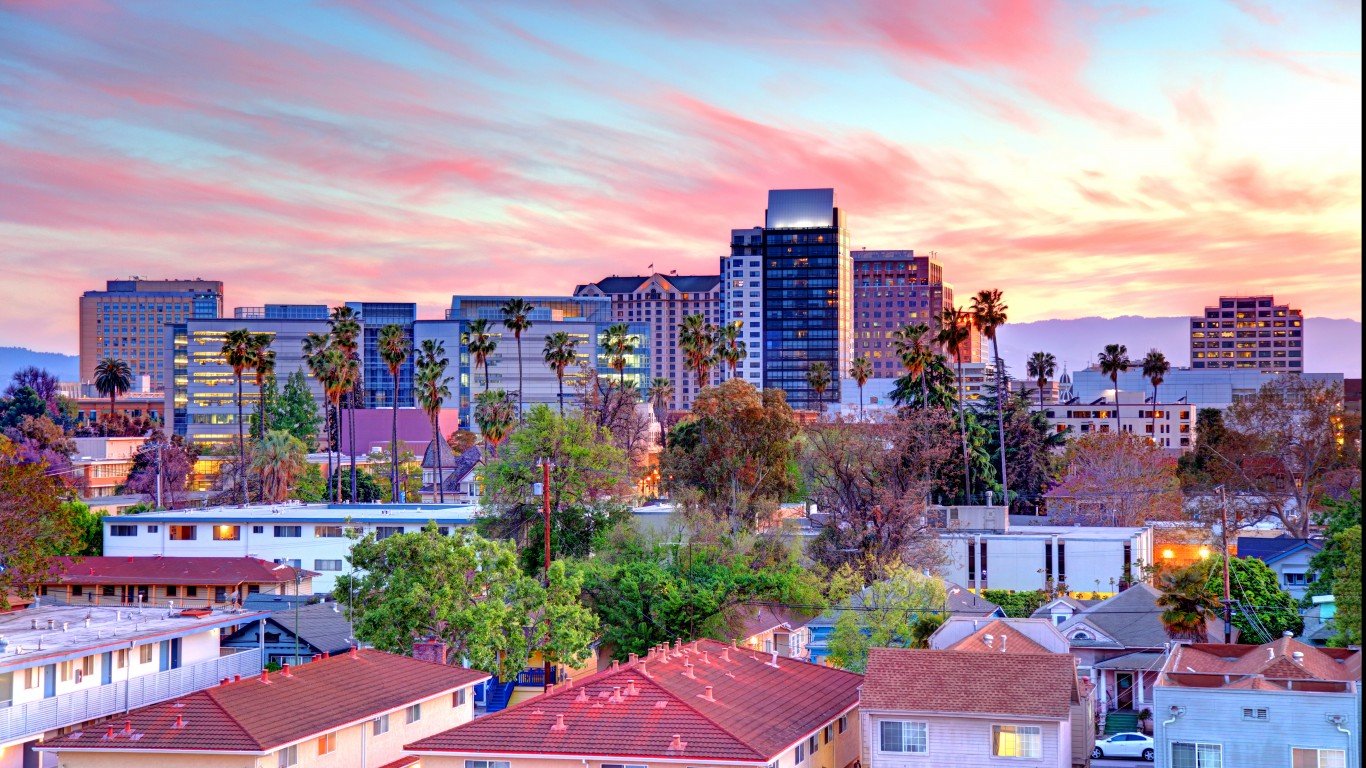
20. San Jose, California
> LawnStarter score: 43.5
> Resident satisfaction with city cleanliness: #28 worst out of 200 cities
> Avg daily PM2.5 (county): 9.1 micrograms per cubic meter
> Population: 1,027,690
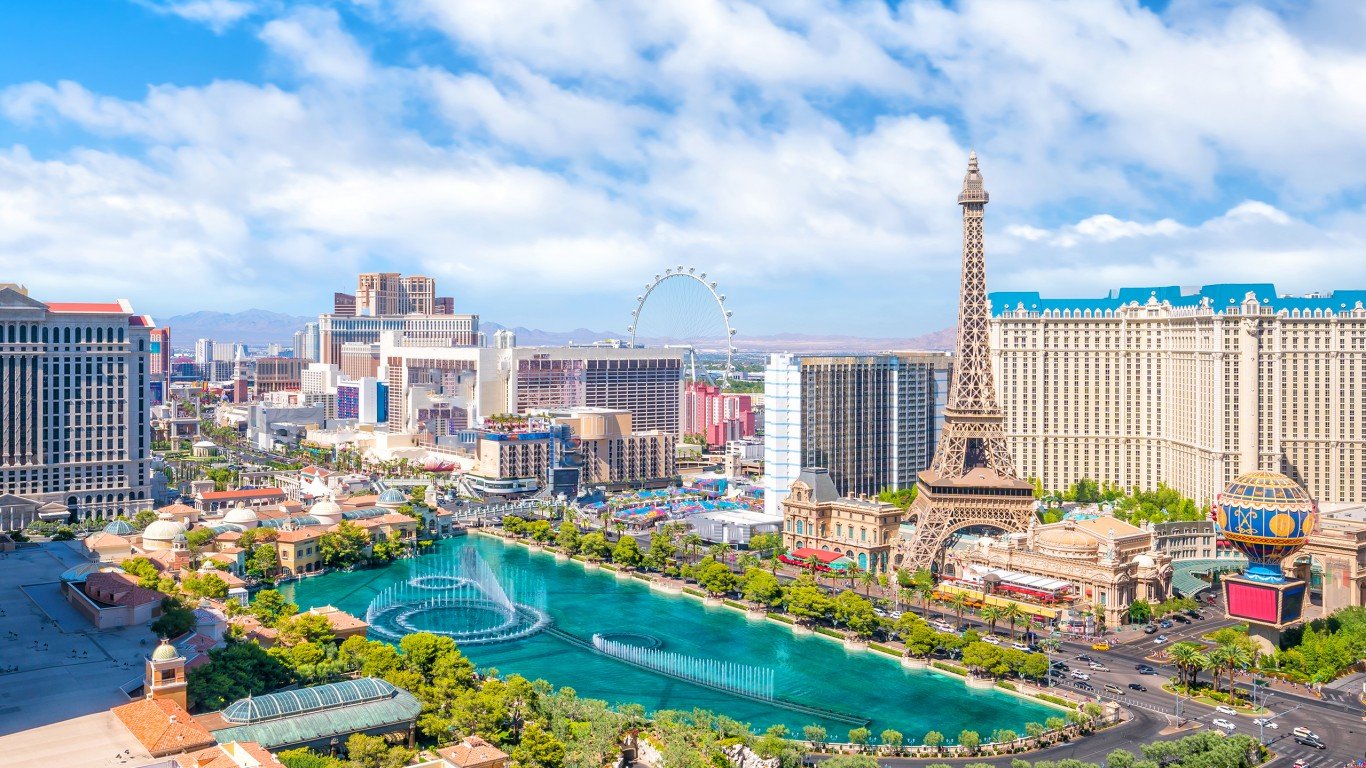
19. Las Vegas, Nevada
> LawnStarter score: 43.6
> Resident satisfaction with city cleanliness: #31 worst out of 200 cities
> Avg daily PM2.5 (county): 10.8 micrograms per cubic meter
> Population: 634,773
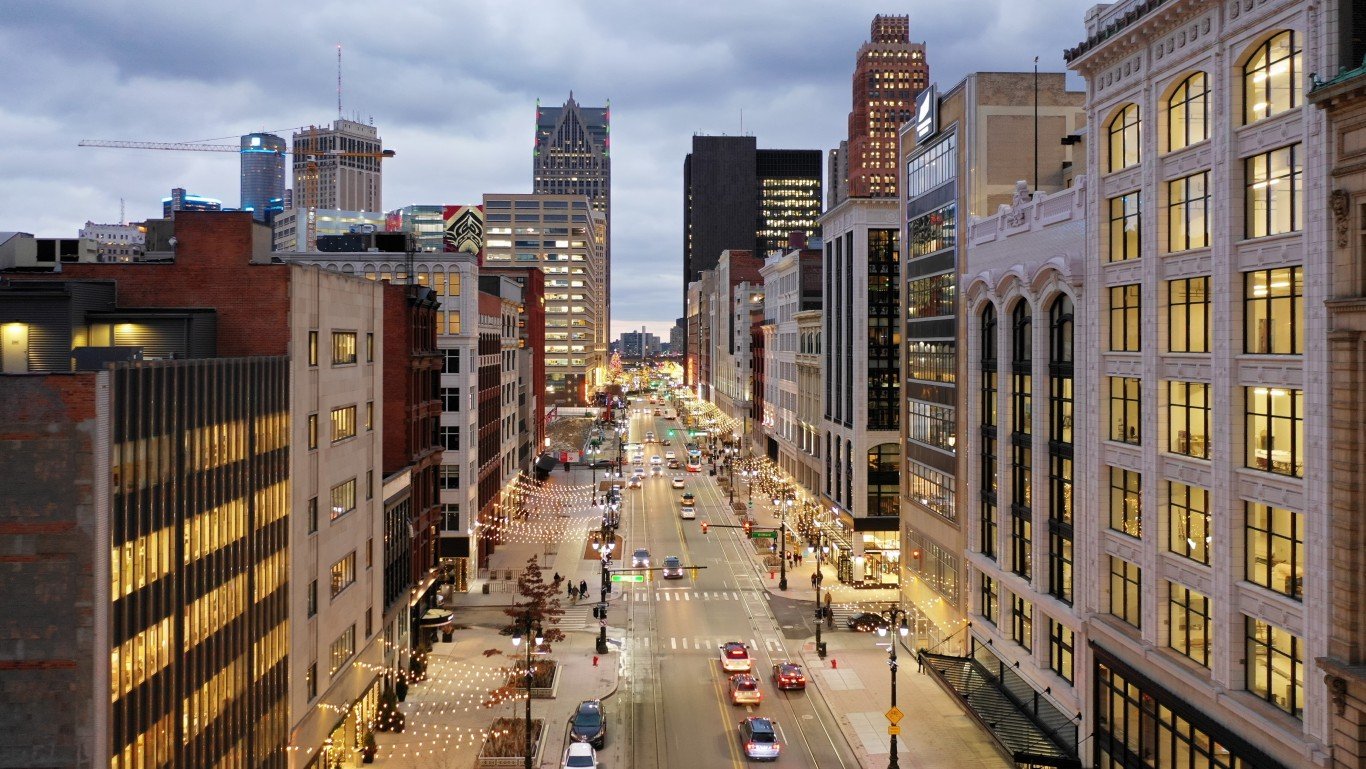
18. Detroit, Michigan
> LawnStarter score: 44.1 (tie)
> Resident satisfaction with city cleanliness: #3 worst out of 200 cities
> Avg daily PM2.5 (county): 11.3 micrograms per cubic meter
> Population: 674,841
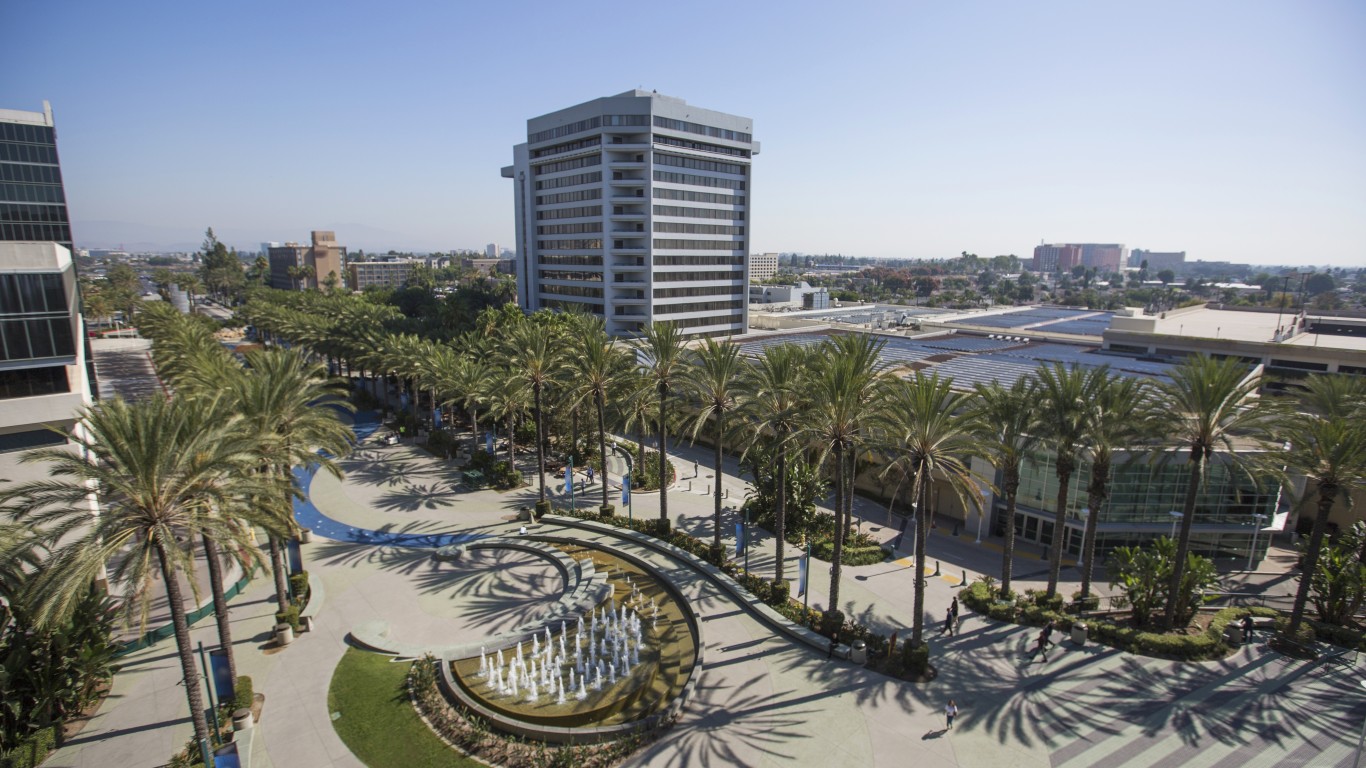
17. Anaheim, California
> LawnStarter score: 44.1 (tie)
> Resident satisfaction with city cleanliness: #22 worst out of 200 cities
> Avg daily PM2.5 (county): 9.4 micrograms per cubic meter
> Population: 349,964
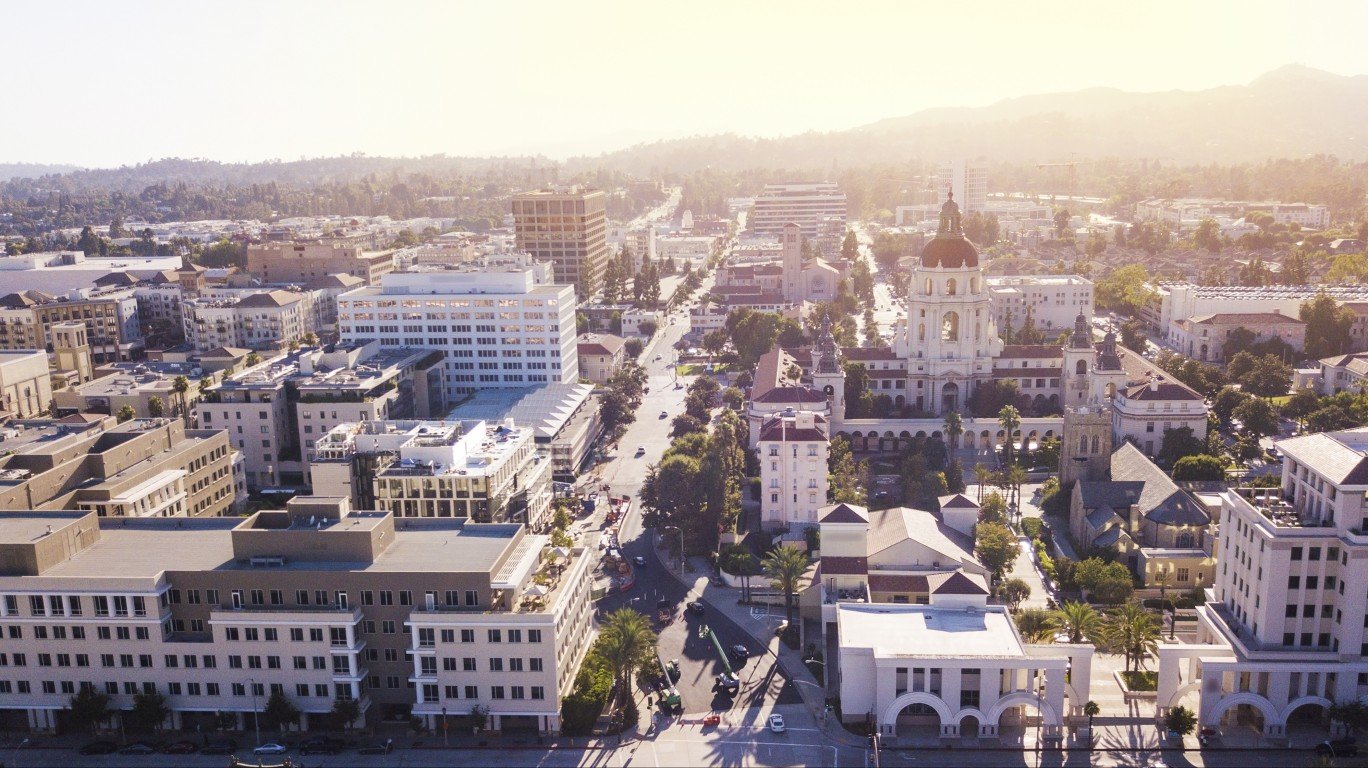
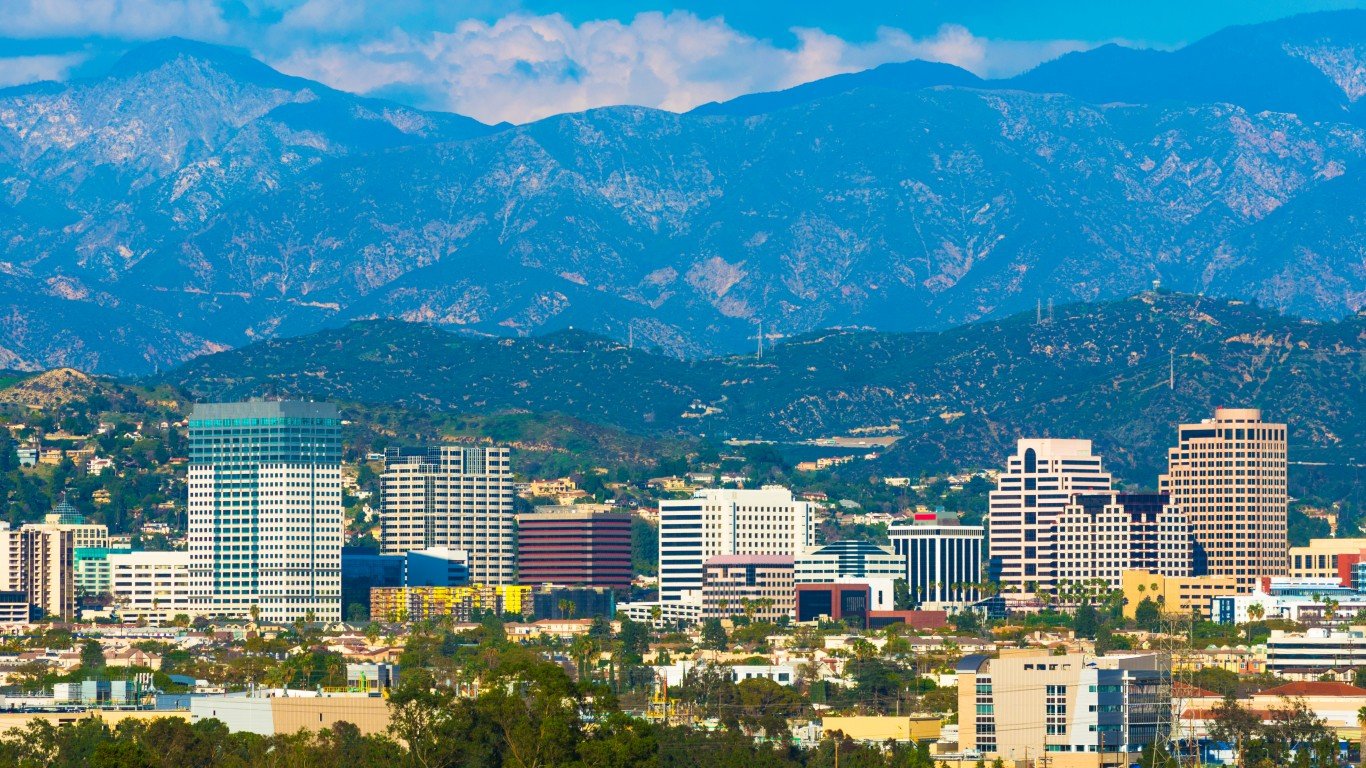
16. Pasadena, California
> LawnStarter score: 44.3
> Resident satisfaction with city cleanliness: #107 worst out of 200 cities
> Avg daily PM2.5 (county): 12 micrograms per cubic meter
> Population: 141,258
15. Fontana, California
> LawnStarter score: 44.4
> Resident satisfaction with city cleanliness: #21 worst out of 200 cities
> Avg daily PM2.5 (county): 14.8 micrograms per cubic meter
> Population: 210,759
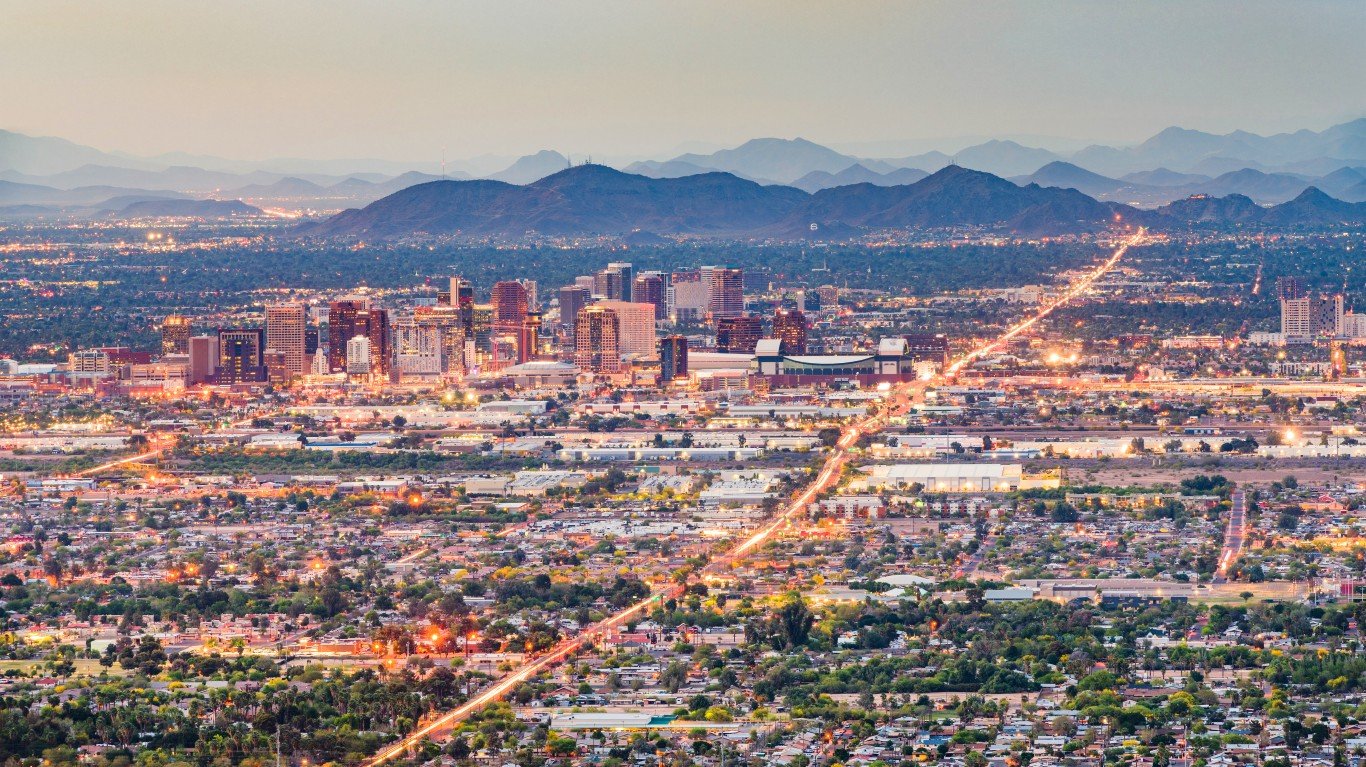
14. Phoenix, Arizona
> LawnStarter score: 44.8
> Resident satisfaction with city cleanliness: #38 worst out of 200 cities
> Avg daily PM2.5 (county): 9.5 micrograms per cubic meter
> Population: 1,633,017
13. Mesa, Arizona
> LawnStarter score: 45
> Resident satisfaction with city cleanliness: #43 worst out of 200 cities
> Avg daily PM2.5 (county): 9.5 micrograms per cubic meter
> Population: 499,720
12. Glendale, California
> LawnStarter score: 46.3
> Resident satisfaction with city cleanliness: #78 worst out of 200 cities
> Avg daily PM2.5 (county): 12 micrograms per cubic meter
> Population: 200,232
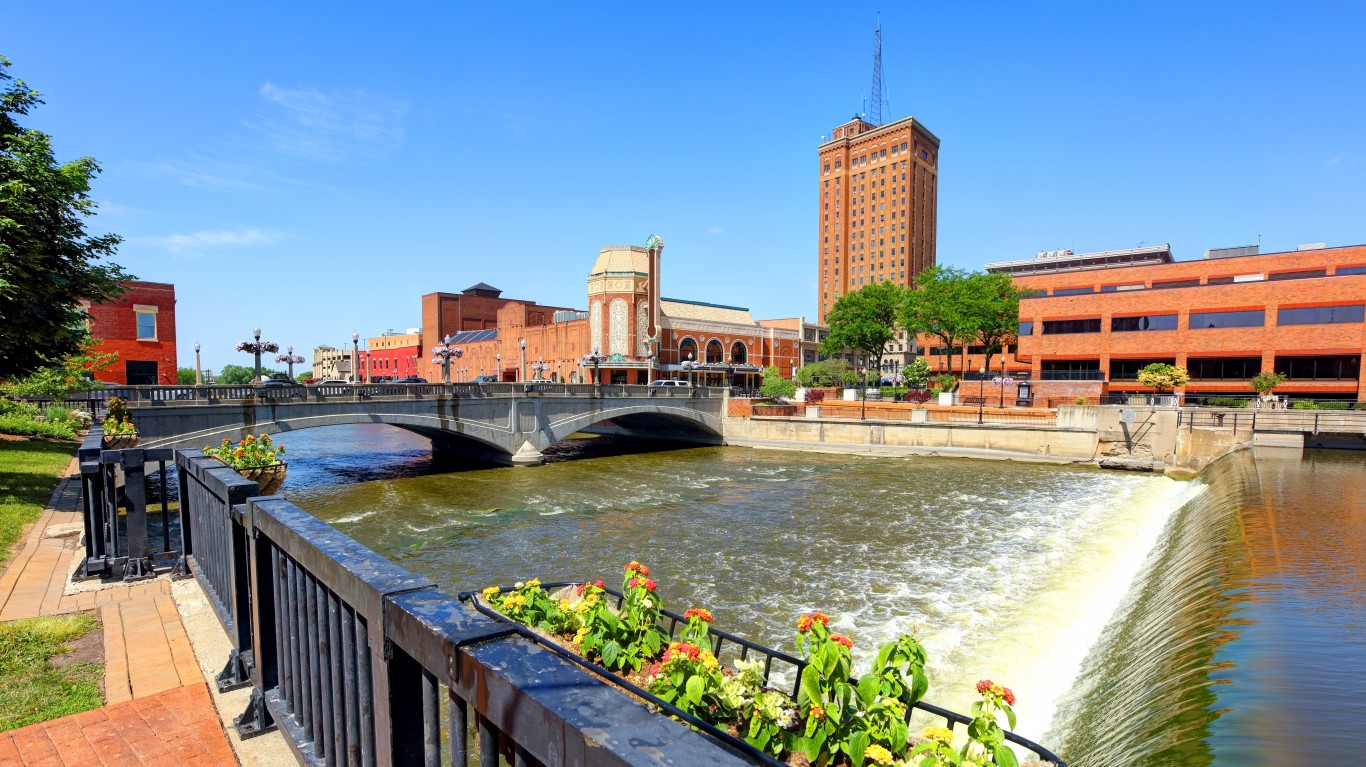
11. Aurora, Illinois
> LawnStarter score: 46.4
> Resident satisfaction with city cleanliness: #52 worst out of 200 cities
> Avg daily PM2.5 (county): 7.8 micrograms per cubic meter
> Population: 199,927
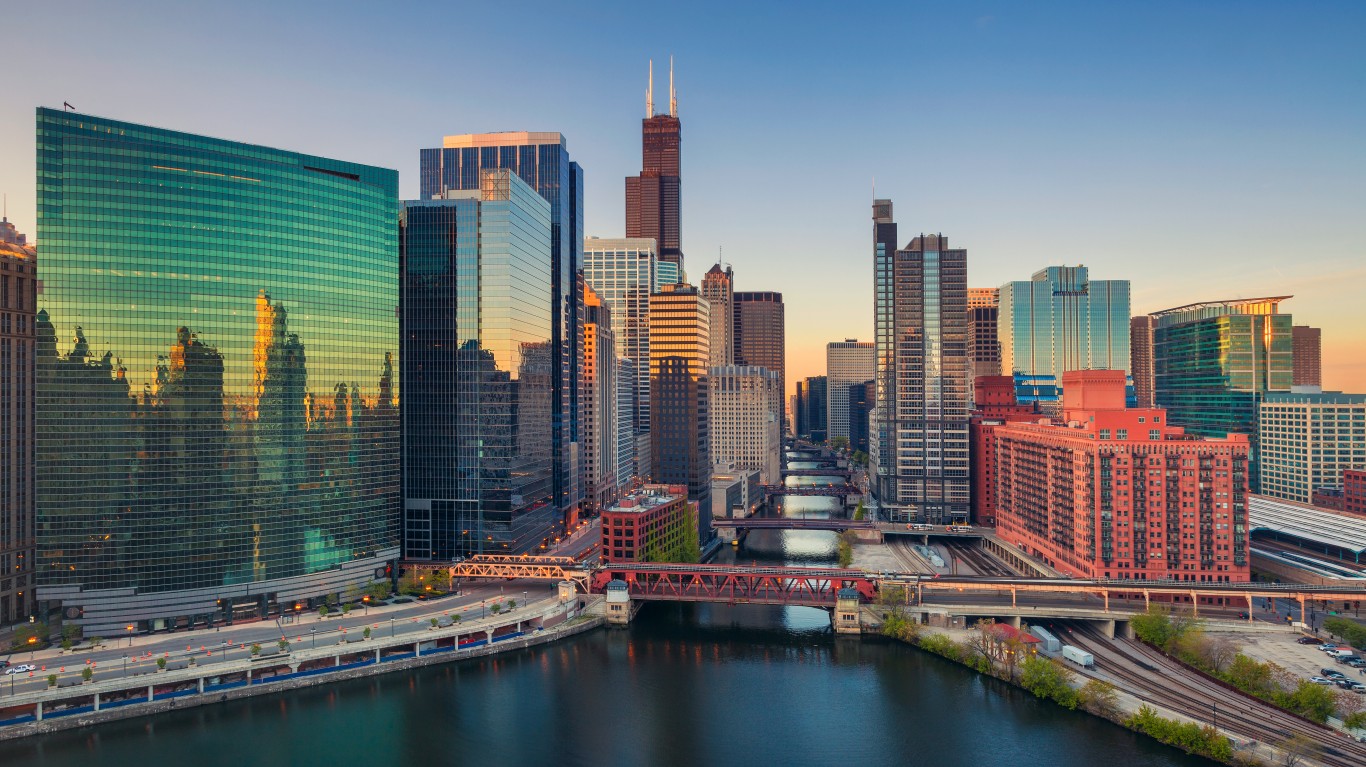
10. Chicago, Illinois
> LawnStarter score: 46.5
> Resident satisfaction with city cleanliness: #63 worst out of 200 cities
> Avg daily PM2.5 (county): 10 micrograms per cubic meter
> Population: 2,709,534
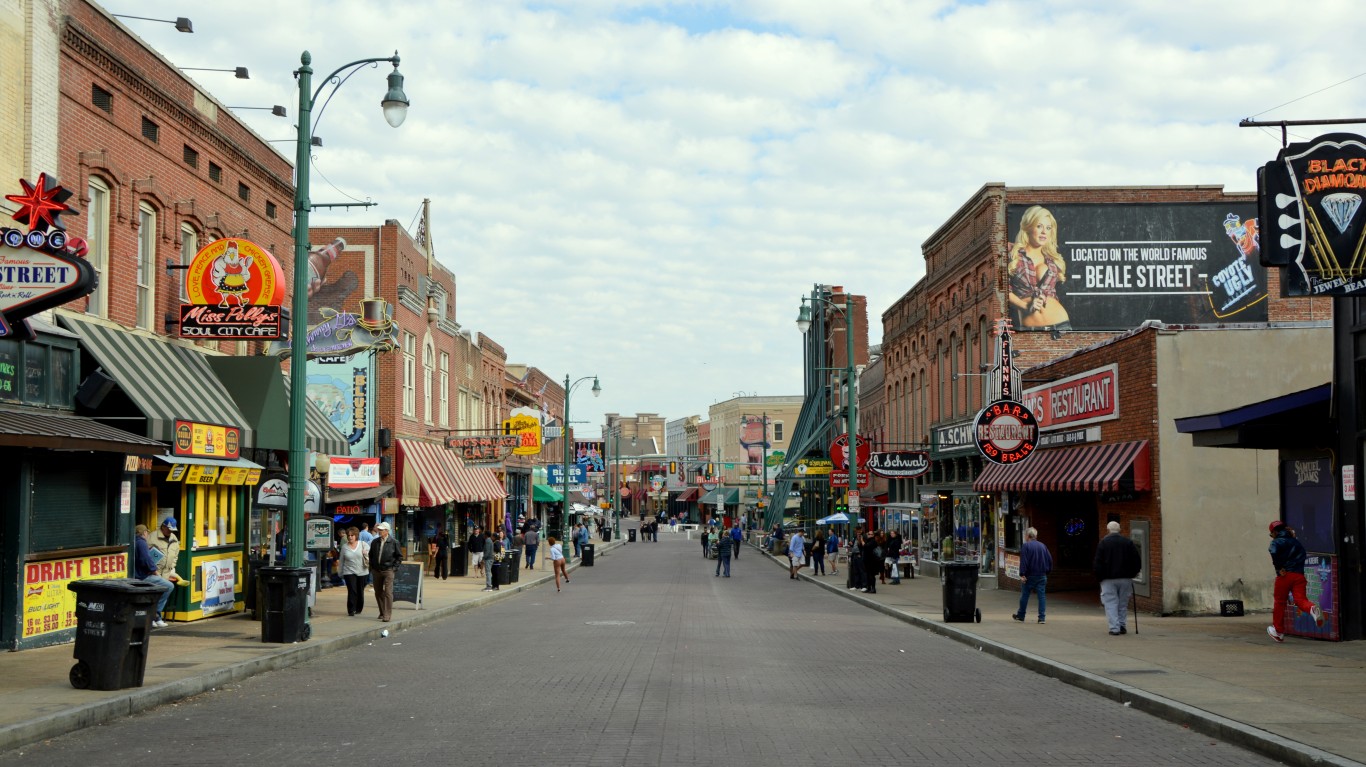
9. Memphis, Tennessee
> LawnStarter score: 46.9
> Resident satisfaction with city cleanliness: #14 worst out of 200 cities
> Avg daily PM2.5 (county): 8.7 micrograms per cubic meter
> Population: 651,932
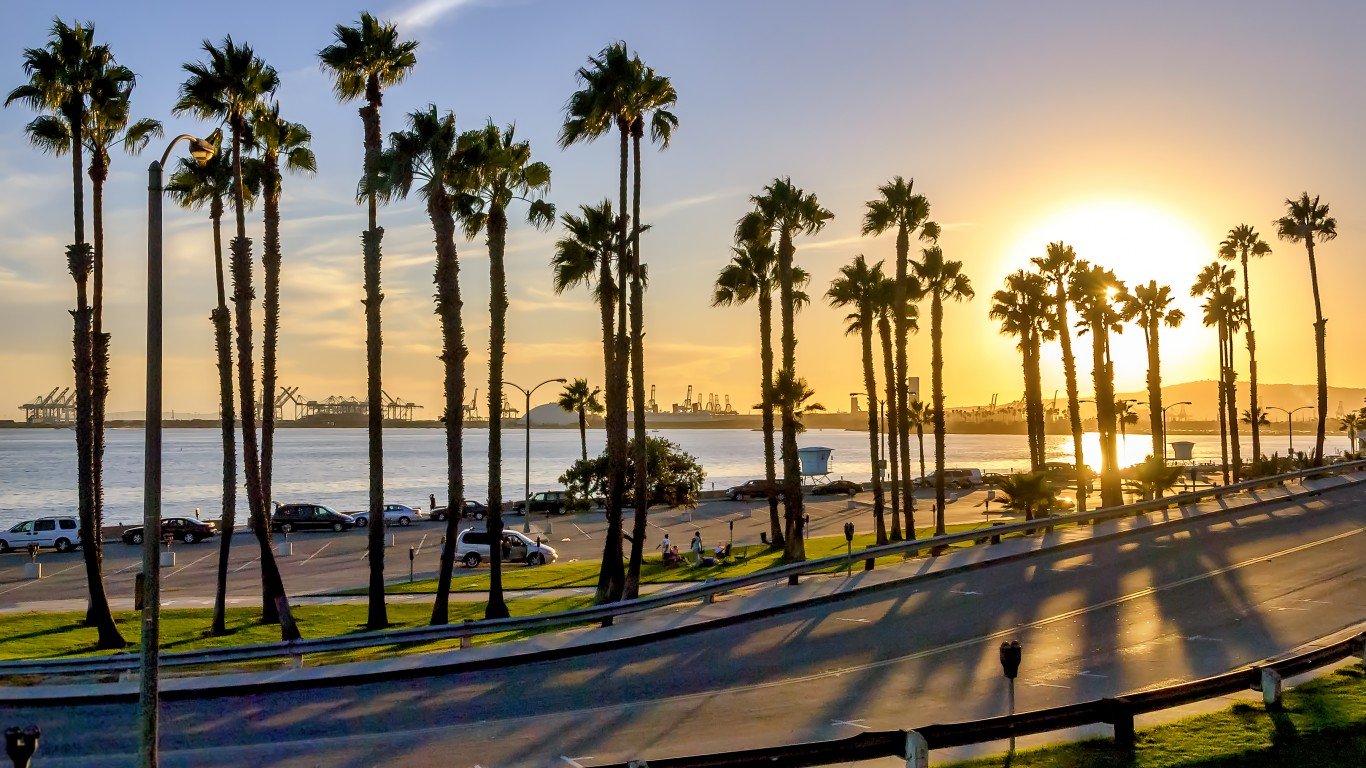
8. Long Beach, California
> LawnStarter score: 48
> Resident satisfaction with city cleanliness: #70 worst out of 200 cities
> Avg daily PM2.5 (county): 12 micrograms per cubic meter
> Population: 466,776
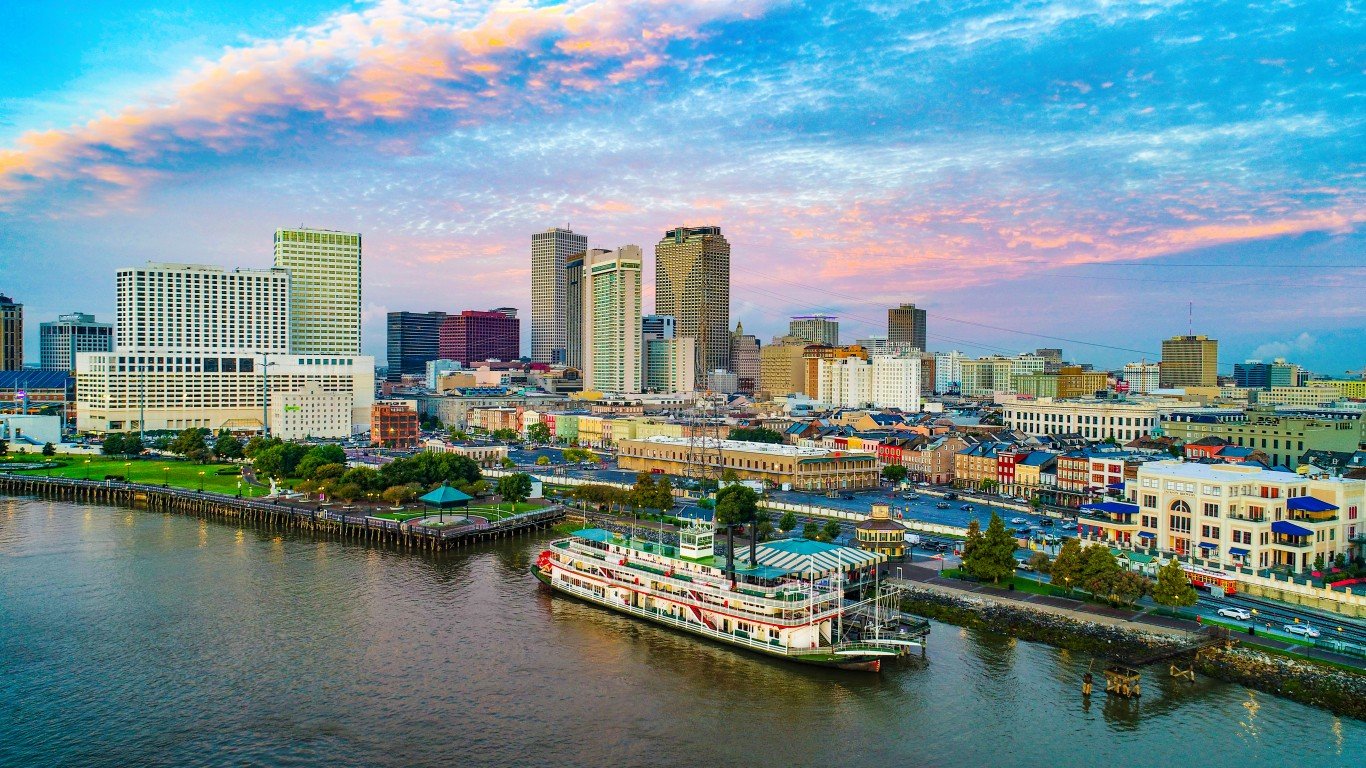
7. New Orleans, Louisiana
> LawnStarter score: 48.4
> Resident satisfaction with city cleanliness: #36 worst out of 200 cities
> Avg daily PM2.5 (county): 7.5 micrograms per cubic meter
> Population: 390,845
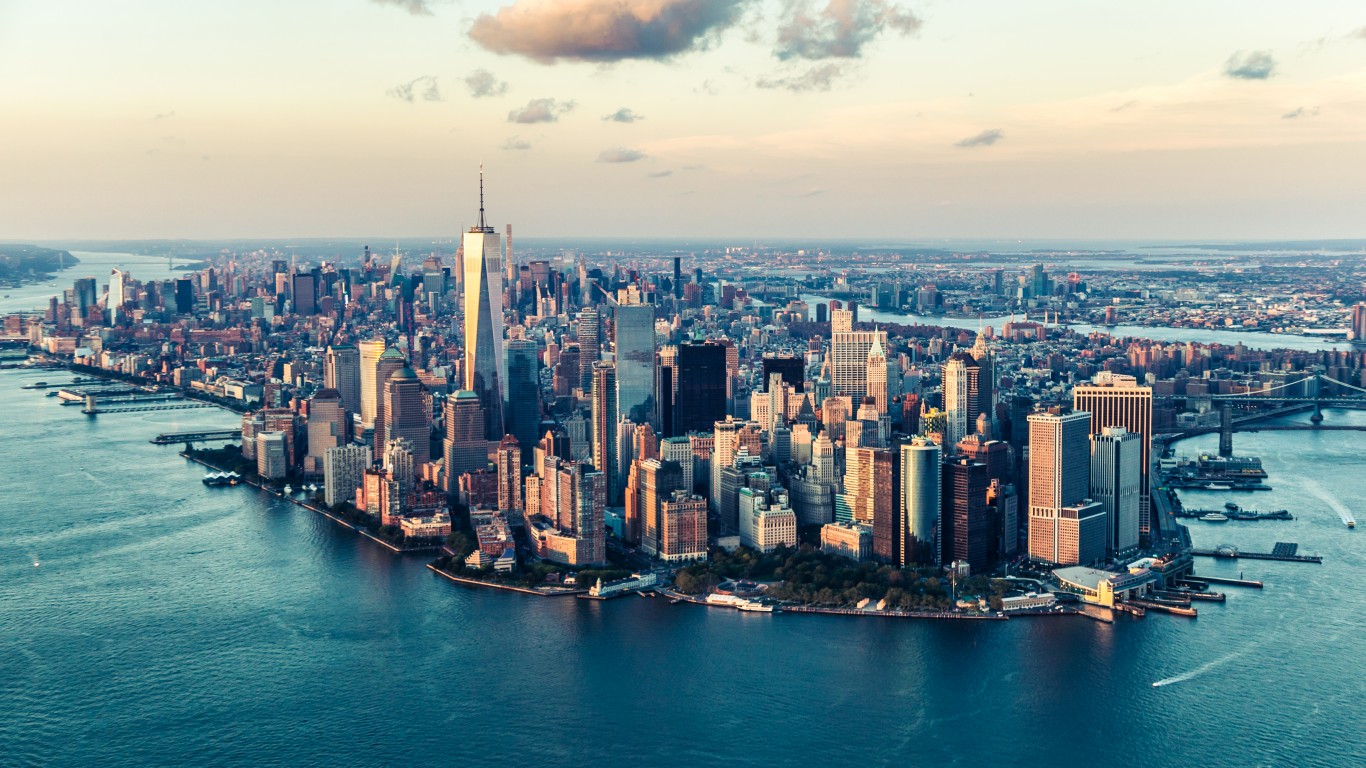
6. New York, New York
> LawnStarter score: 49.2
> Resident satisfaction with city cleanliness: #13 worst out of 200 cities
> Avg daily PM2.5 (county): 9 micrograms per cubic meter
> Population: 8,419,316
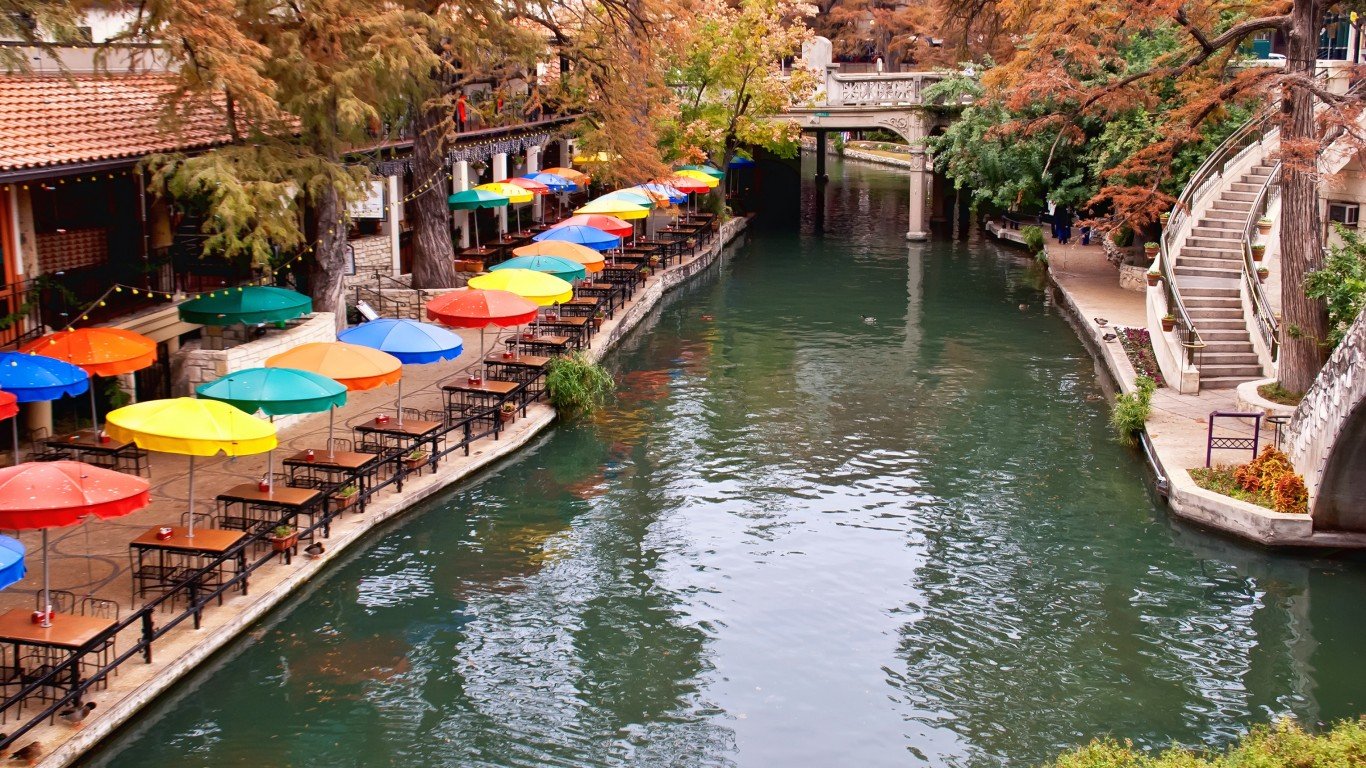
5. San Antonio, Texas
> LawnStarter score: 49.3
> Resident satisfaction with city cleanliness: #34 worst out of 200 cities
> Avg daily PM2.5 (county): 7.3 micrograms per cubic meter
> Population: 1,508,083
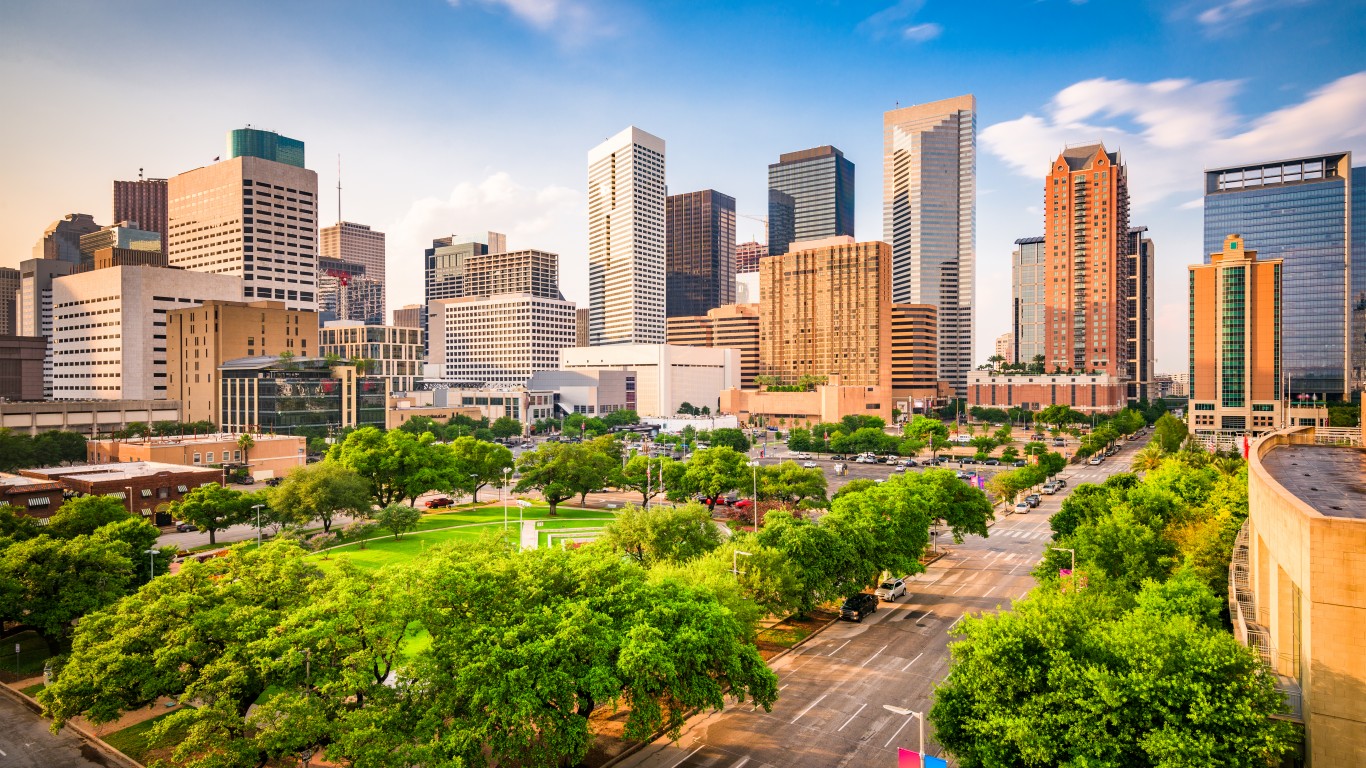
4. Houston, Texas
> LawnStarter score: 50
> Resident satisfaction with city cleanliness: #33 worst out of 200 cities
> Avg daily PM2.5 (county): 10.1 micrograms per cubic meter
> Population: 2,310,432
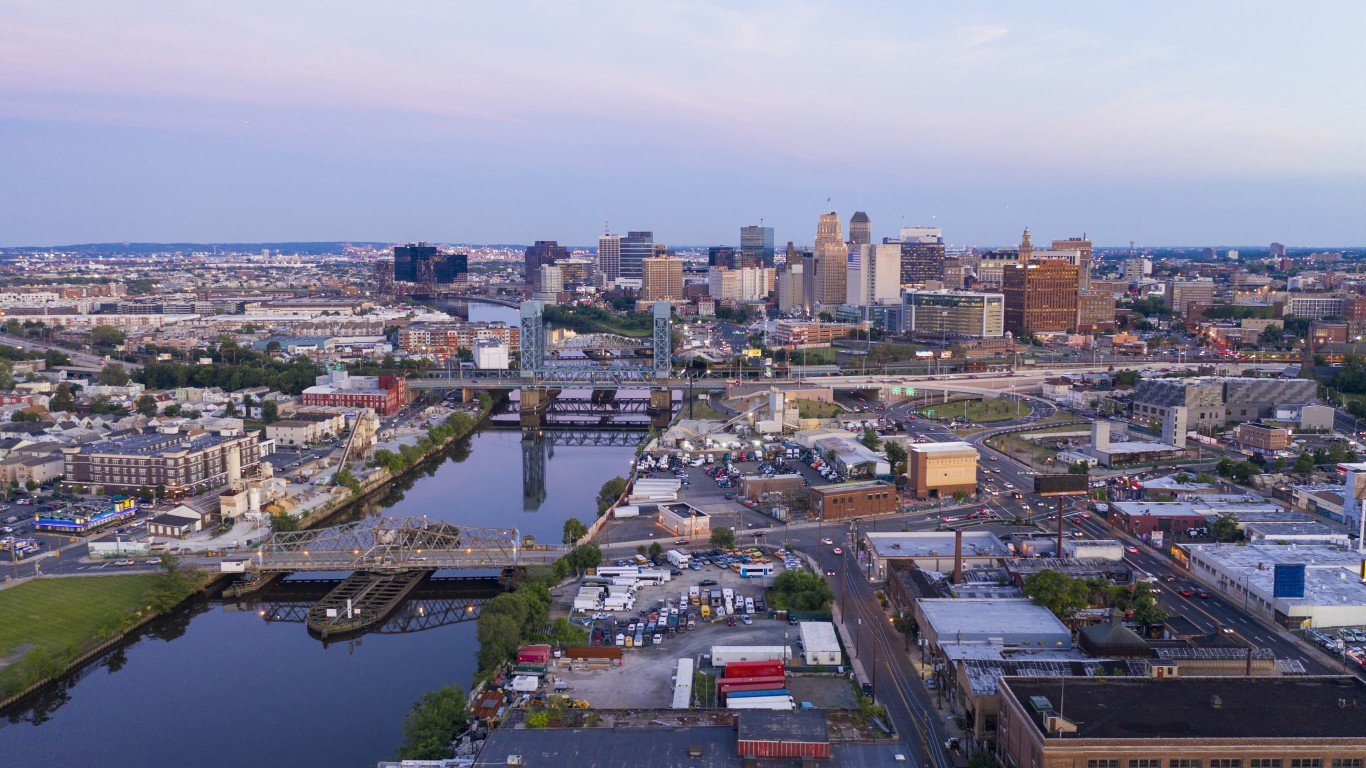
3. Newark, New Jersey
> LawnStarter score: 54.3
> Resident satisfaction with city cleanliness: #2 worst out of 200 cities
> Avg daily PM2.5 (county): 8.9 micrograms per cubic meter
> Population: 281,054
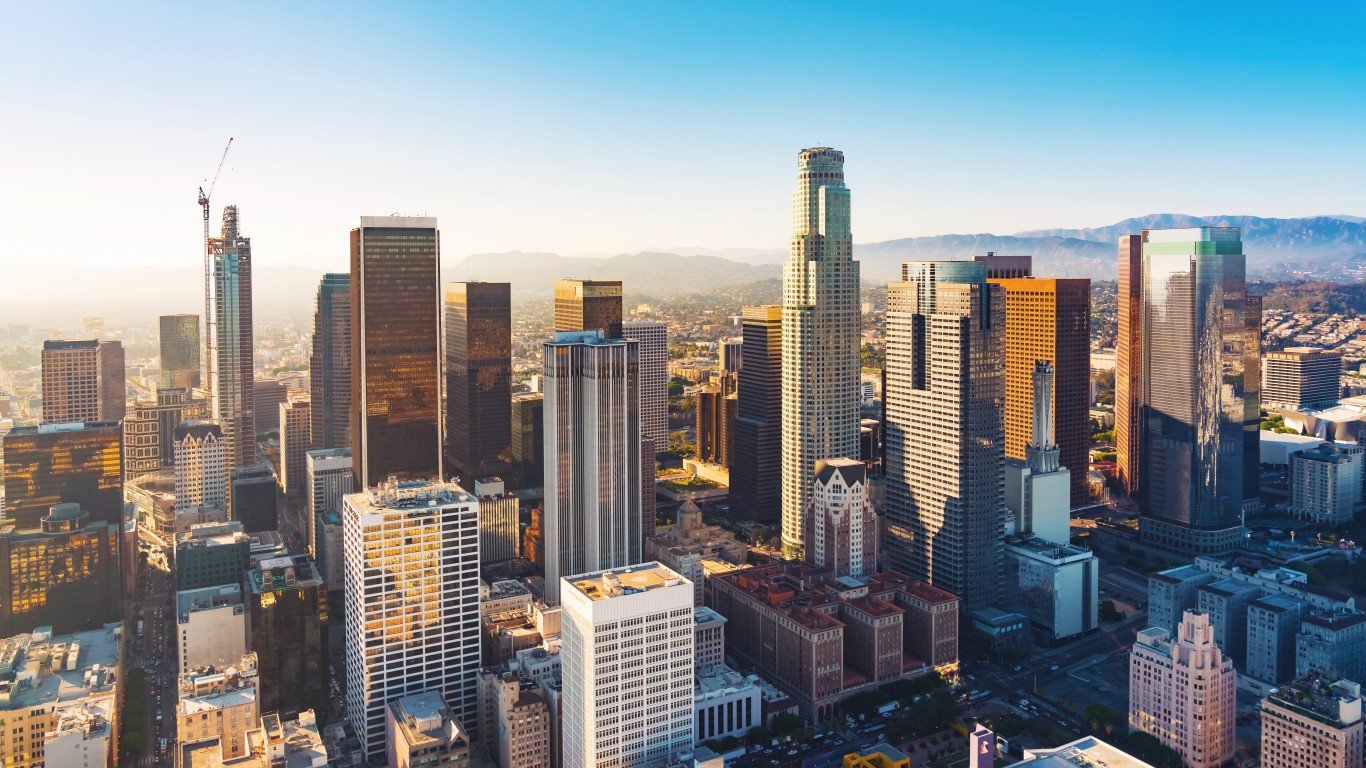
2. Los Angeles, California
> LawnStarter score: 54.7
> Resident satisfaction with city cleanliness: #12 worst out of 200 cities
> Avg daily PM2.5 (county): 12 micrograms per cubic meter
> Population: 3,966,936
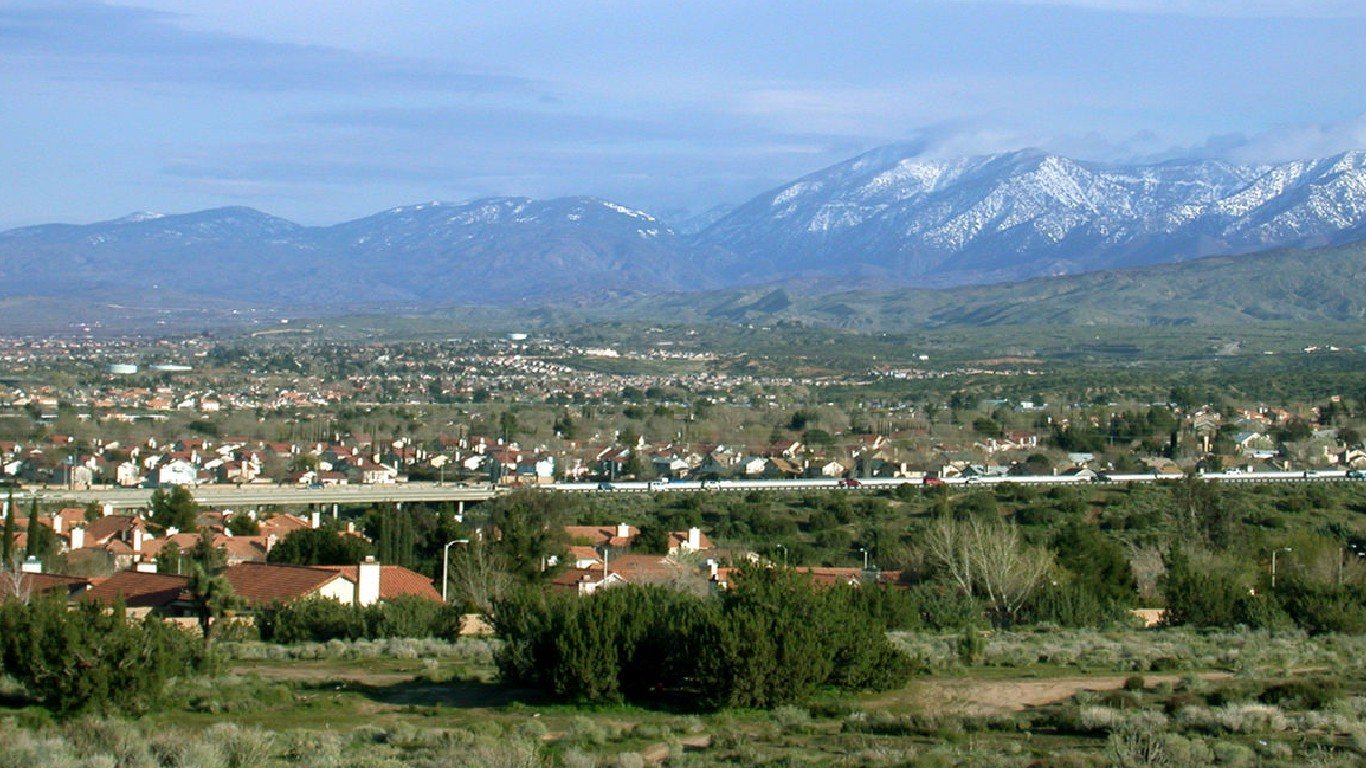
1. Palmdale, California
> LawnStarter score: 55.3
> Resident satisfaction with city cleanliness: #7 worst out of 200 cities
> Avg daily PM2.5 (county): 12.0 micrograms per cubic meter
> Population: 156,293